Indications for ECG
ECG is a non-invasive and painless research method that has no contraindications. The procedure is carried out on a planned or emergency basis.
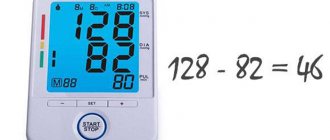
Planned electrocardiography is prescribed:
- before surgical interventions;
- during pregnancy;
- during preventive examinations of the population;
Scheduled electrocardiography is prescribed in certain cases.
Also, periodic electrocardiography must be performed for persons with health conditions or occupational hazards:
- in the presence of atherosclerotic plaques;
- hypertension;
- elevated blood cholesterol levels;
Emergency electrocardiography is performed to identify pathological processes in the heart, some of which require immediate intervention.
An emergency ECG is prescribed for:
- sharp pain localized behind the sternum or in the upper abdomen;
- sudden onset of shortness of breath;
- heart murmurs identified during initial diagnosis;
- with discomfort in the heart.
What does an electrocardiogram consist of?
To understand the elements that make up the electrocardiogram, it is necessary to delve into the processes occurring in the heart before and during its contraction.
For the heart muscle to contract, an electrical impulse must first travel through it. During the propagation of this impulse, the muscle becomes a source of electrical current, which is conducted into the surrounding tissues and onto the surface of the body.
If electrodes are placed on both sides of the heart, the potential difference that occurs during the propagation of excitation can be recorded and displayed on paper. The resulting diagram will be called an electrocardiogram.
In practice, three methods of placing electrodes, called standard leads, are used:
- In the first lead, the electrode on the left hand is positive, and on the right hand it is negative.
- In the second lead, positive electrodes are installed on the left leg and negative electrodes on the right arm.
- In the third lead, the negative electrode is located on the left arm, and the positive electrode on the right leg.
When the electrical phenomena occurring in the heart are recorded over a period of time, an image is obtained consisting of teeth, segments and intervals. The waves represent a set of positive and negative peaks and reflect the processes of changing the potential difference between the electrodes.
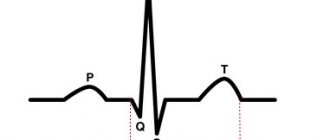
There are waves P, Q, R, S, T, they provide the following information:
- The P wave occurs during atrial depolarization. Depolarization is a process that precedes muscle contraction. Normally, in the second standard lead this wave is positive.
- The QRS complex consists of two negative (Q and S) and one positive (R) waves. They correspond to the process of propagation of ventricular depolarization.
- The T wave occurs when the resting potential of the cardiomyocytes (heart cells) of the ventricles returns to its original level and repolarization occurs. Normally, in the second standard lead the T wave is positive.
Segments are straight line segments connecting adjacent teeth to each other:
- The PQ segment occurs due to a delay in the impulse in the atrioventricular node; its duration can be used to judge the functioning of the conduction system of the heart.
- The ST segment corresponds to the time during which both ventricles are in a depolarized (excited) state.
The intervals consist of a tooth or several teeth and a segment:
- The value of the PQ interval is defined as the distance between the beginning of the P wave and the QRS complex. It displays the time period spent on the propagation of excitation from the atrium to the ventricles.
- The values of the QRS complexes on cardiograms are represented by the intervals from the Q wave to the S wave, and corresponds to the process of ventricular excitation.
- The QT interval refers to the distance from the starting point of the Q wave to the end of the T wave. It reflects the depolarization and repolarization of the ventricles.
How to decipher an ECG
Decoding the electrocardiogram includes assessment of intervals, waves and segments.
The duration of the intervals, the amplitude of the waves, their frequency and rhythm have strict normal limits, and deviation from these norms can indicate many pathologies. It is important to understand that only a doctor can diagnose a pathological change in an electrocardiogram, because the cardiogram readings can change.
The PQ interval on the ECG, the norm of which also has fairly strict values, can be differentiated according to the age categories of patients. Children's norms for this indicator, for example, are lower than those of adults. This factor is due to the peculiarities of children's physiology and the faster conduction of intracardiac excitation impulses.
ON THE. Skuratova, L.M. Belyaeva, S.S. Ivkina
Gomel Regional Children's Clinical Hospital
Belarusian Medical Academy of Postgraduate Education
Gomel State Medical University
The phenomenon of shortened PQ interval in young athletes: is sports contraindicated?
The phenomenon of a shortened PQ interval is the presence on an electrocardiogram (ECG) of a PQ(R) interval of less than 120 ms in adults and less than the age norm in children, while maintaining the normal shape of the QRS complexes and the absence of arrhythmias, and the shortened PQ(R) interval syndrome (CLC syndrome) – combination of ECG changes and paroxysmal supraventricular tachycardia. The incidence of the short PQ interval phenomenon in children ranges from 0.1% to 35.7%. Until now, data concerning the study of the natural course of the phenomenon of a short PQ interval in children and the prognosis of the disease have not been presented in the literature. Currently, there are no studies devoted to long-term clinical observation of children with the phenomenon of a short PQ interval, so the risk of tachycardia attacks in them, as well as the likelihood of normalizing the duration of the PQ interval, is unknown. The absence of such data leads to unjustified restrictions on physical activity, including professional sports, in this group of children.
We analyzed the most interesting clinical cases of young athletes involved in sports classes and sports sections of various types.
Evgeniy G., 11 years old
, was admitted for examination due to a shortening of the PQ interval detected on the ECG. He is involved in the main group in physical education, from the first grade he regularly attends school sections in volleyball, football, and athletics, and regularly participates in competitions. He has no complaints and tolerates physical activity well. Heredity is not burdened, there are no somatic diseases. On the ECG: shortening of the PQ interval to 0.09 s; according to the treadmill test, very high physical performance was revealed (METs = 11.9) against the background of a shortened PQ interval (Figure 1)
Figure 1—Shortening of the
PQ in an 11-year-old boy (treadmill test fragment)
According to echocardiography, no pathology was detected. According to Holter monitoring (HM), it was revealed that during the day the phenomenon of shortening of the PQ interval was transient in nature, and this phenomenon was recorded against the background of a decrease in heart rate to 60/min, against the background of supraventricular migration of the pacemaker, sinus arrhythmia and episodes of 2nd degree SA blockade 1 type. The most unexpected was the detection of ventricular extrasystoles in the amount of 705 isolated extrasystoles with episodes of trigeminy, which confirms the functional instability of the myocardium in the boy (Figure 2).
Figure 2—Episode of ventricular allorhythmia of the trigeminy type, recorded before bedtime (same child)
When conducting cardiointervalography (CIG), the boy was found to have symptaticotonia (IN1=86.8) and normal autonomic reactivity (IN2/IN1=1), which indicates the “immaturity” of the mechanisms of adaptation to physical activity, under unfavorable factors, for example, physical overstrain, these features of autonomic regulation can contribute to the progression of changes in the myocardium.
In this case, competitive loads are contraindicated for the boy, sports should be carried out to the point of natural fatigue, the child needs to monitor the ECG 2 times a year, conduct courses of cardiotrophic therapy, but there is no need to limit physical education for health purposes.
Ilya, 9 years old,
has been playing table tennis in the sports section for 2 years and regularly participates in competitions. On the ECG: the phenomenon of shortening of the PQ interval. EchoCG: no pathology. According to the results of HM, no pathology was identified. There are no complaints, he tolerates training well. During the treadmill test, no rhythm disturbances were registered, the blood pressure response was normotonic, the recovery of heart rate and blood pressure after exercise was adequate, physical performance was very high (METs = 12.5), (Figure 3).
Figure 3—Fragment of the treadmill test for a boy playing table tennis (phase 3).
Shortening of the PQ
According to the CIG data, the boy had vagotonia (IN1=27) and hypersympathetic autonomic reactivity (IN2/IN1=5.33). In this case, the level of functioning of the physiological system is assessed as high, the current functional state is assessed as good, despite the increased sensitivity of the sinus node to orthostatic stress. Table tennis is not contraindicated for the boy, but dynamic monitoring every six months is recommended.
Andrey, 10 years old,
does not play sports, complains of palpitations. With CM, the PQ interval is shortened, including against the background of mid-atrial rhythms (Figure 4).
Figure 4—Shortening of the
PQ against the background of supraventricular migration of the pacemaker at a heart rate of 57/min in a 9-year-old boy during sleep. During
wakefulness, a paroxysm of supraventricular tachycardia with a max. Heart rate 198/min (Figure 5).
Figure 5 –
Supraventricular tachycardia with max. Heart rate 198/min in a 9-year-old boy with a shortening of the PQ
. In this case, the boy is advised to consult an arrhythmologist and engage in recreational physical education.
Conclusions:
When identifying the phenomenon of a shortened PQ interval in young athletes, an in-depth examination is necessary. The cardiologist’s tactics and, accordingly, recommendations regarding further sports activities are based on a set of functional diagnostic techniques. The presented clinical cases confirm the need for a differentiated approach; the main aspect of monitoring “controversial” cases is dynamic control. In “controversial” cases, the use of minimally invasive cardiac surgery, in particular electrophysiological studies, is recommended.
Literature:
1. Makarov, L.M. Sudden death in young athletes / L.M. Makarov // Cardiology. – 2010. – No. 2. – P. 78–83.
2. Makarova, G.A. Handbook of children's sports physician: clinical aspects / G.A. Makarova. – M.: Medicine, 2008. – 437 p.
ECG analysis
In the process of analyzing the electrocardiogram, the doctor receives information about the heart rate (HR), the main rhythm, the presence or absence of extraordinary contractions and disturbances in the conduction of the electrical impulse.
The patient should understand that many factors can influence the result of the electrocardiogram. Any stress factors, be it emotional overexcitation, physical activity or a cup of coffee before the examination, can significantly distort the real picture. Ideally, at the time of the examination, the patient should be well-rested and in a calm, non-excited state.
In order for the research results to be reliable, a number of rules should be followed:
- avoiding strong tea, coffee and energy drinks several hours before the examination;
- lack of physical and emotional stress;
- no excessive load on the gastrointestinal tract. If the procedure is scheduled for the morning, you should postpone a hearty breakfast. If the procedure is performed during the day, it is better not to eat a few hours before the ECG;
- do not worry directly during the examination. The ECG procedure is absolutely painless and harmless, and excessive emotional stress can affect the reliability of the results;
- Smoking and drinking alcohol are prohibited several hours before the examination;
- You should not use medications that affect the cardiovascular system.
A competent specialist, having seen deviations from the norm in ECG indicators, will make sure that all of the above rules are followed, and only after that will make a final diagnosis.
ECG during pregnancy. Norm and reasons for deviations
Electrocardiography (ECG) is a procedure for determining the electrical activity of the heart and its subsequent recording on film. The method provides information about the frequency and rhythm of the heartbeat, shows the location of the heart, and allows you to estimate the speed of electrical impulses.
The study is carried out using a special device. Electrodes are attached to the skin, the electrocardiograph records the total potential difference of all heart cells in a certain lead (between two points) and displays the data.
Using an ECG, abnormalities in the functioning of the heart are diagnosed: blockades, various forms of arrhythmia, dysfunction.
During pregnancy, women undergo an ECG at least twice. The procedure is performed both for the pregnant woman herself and for the fetus. If there are no indications for the study, the cardiogram is taken for registration and maternity leave.
During pregnancy, the volume of circulating blood increases, the level of hormones changes, and as a result, the load on the cardiovascular system increases. An ECG is performed in the early stages of pregnancy to diagnose abnormalities, if any, prescribe the necessary treatment, and prevent possible complications.
Indications for ECG:
- Frequent pressure surges
- Pain in the heart area
- Dizziness, fainting
- Various complications during pregnancy: severe forms of gestosis and toxicosis, oligohydramnios, polyhydramnios.
If the pregnancy is progressing normally, the electrocardiogram will not show significant changes. If deviations from normal values or negative changes are detected, the pregnant woman is referred to a cardiologist.
ECG procedure
An ECG for pregnant women does not differ from the standard electrocardiography procedure. The patient is in a supine position. The doctor gives you the opportunity to rest and relax for a few minutes, since stress and physical tension affect the results of the cardiogram. Special plates are attached to the shins and wrists, and electrodes are attached to the chest. The surface of the skin is degreased by wiping with alcohol to improve impulse conduction.
A red electrode is placed on the right hand, and a yellow one on the left. A green electrode is attached to the left leg, and a black one to the right leg. It is necessary to ground the current in case the electrocardiograph fails. The output tape displays 12 graphs with the directions of cardiac electrical impulses. You need to come to the examination rested, do not worry, eat food two hours before the examination. The procedure takes from 15 to 20 minutes. The resulting cardiogram is sent to a doctor for interpretation.
Leads for a routine ECG procedure
- Standard: — between the hands (I); between the left leg and right arm (II); between left leg and left arm (III)
- Reinforced (from the limbs): - from the right hand (aVR); from the left hand (aVL); from left foot (aVF)
- Chest leads: - V1, V2, V3, V4, V5, V6
Additional leads
- According to Neb (used to register the potential between points on the chest)
- Leads V7-V9 to continue standard chest leads
- V3R - V6R (reflection of chest leads V3 - V6)
Decoding and norm of readings
Normal heart rate readings (HR): 60-80 beats per minute. Less than 60 beats/min – bradycardia. Occurs in athletes. More than 90 beats/min - tachycardia. Occurs during emotional and physical stress in healthy people
The correct rhythm is sinus. Atrial or ventricular rhythms require additional diagnosis and treatment.
The position of the heart is characterized by the EOS (electrical axis of the heart). Normal: from 30 to 70 degrees. During pregnancy, a value from 70 to 90 degrees is not a pathology. Often there is a displacement of the heart and diaphragm. The movement occurs along the sagittal axis. In this case, the normal values are sinus. After the birth of the child, the indicators return to normal.
The speed of excitation is determined by the location and size of the waves on the cardiogram. The electrical impulse conduction time increases with blockades (atrial, atrioventricular, bundle branch block)
Example of an ECG conclusion standard: Regular sinus rhythm, heart rate 75 beats/min, normal EOS
Fetal ECG (CTG): Performed in the last stages of pregnancy, before childbirth. Shows the fetal heart rate and baby's movements. During childbirth - the frequency of contractions. At earlier stages, CTG is performed to study the condition of the fetus.
Safety
Electrocardiography is one of the safest types of diagnostics. The ECG procedure is absolutely painless and safe for the expectant mother and child. During the study, there is no impact on organs and tissues. Does not cause changes in a woman's milk. An ECG is just a recording of the electric field coming from the heart. Has no contraindications. It is carried out for pregnant women, fetuses, small children, and people in serious condition.
What is PQ interval
The PQ interval is the distance from the beginning of the positive P wave to the beginning of the negative Q wave (or to the positive R wave if the Q wave is not pronounced or absent). This interval reflects the process of impulse conduction from the atria to the ventricles through the atrioventricular node.
This interval reflects the time during which the electrical impulse spreads from the place where it was generated (atrium) to the ventricles, which, thanks to this “signal,” contract and push a portion of blood into the great vessels.
The atrioventricular node serves as an intermediate point through which the electrical impulse passes. Normally, it is delayed at this intermediate point in order to prevent simultaneous contraction of the atria and ventricles.
Normal PQ interval in children and adults
The PQ interval on the ECG (the norm for adults is 0.12-0.20 s) should vary strictly within a certain range. Anything that goes beyond this is pathological.
PQ interval on ECG (normal for adults and children)
However, it should be understood that the value of this parameter depends on the heart rate (the higher the heart rate, the faster the impulse propagates). Therefore, it is more correct to evaluate the nature and state of the atrioventricular connection as the ratio of the duration of the PQ interval to the duration of the entire cardiac systole (PT).
ECG in children has its own peculiarities. Differences from the electrocardiogram in adults are most pronounced at an early age; after 13-14 years, its characteristics are increasingly closer to the standard norm. The PQ interval is shorter in children, which is due to a higher heart rate compared to adults.
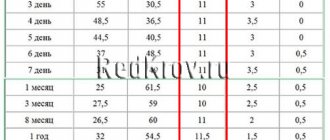
The PQ interval and heart rate values when deciphering an ECG for children are normally based on the following indicators:
| Age (years) | Heart rate (beats per minute) | Interval (s) |
| 0-1 | 120-140 | 0,09-0,12 |
| 1-2 | 110-130 | 0,10-0,12 |
| 3-4 | 90-110 | 0,11-0,13 |
| 5-7 | 80-105 | 0,12-0,14 |
| 8-11 | 75-95 | 0,12-0,14 |
| 12-15 | 70-90 | 0,12-0,16 |
Main features of a normal ECG in children
This article presents modern views on ECG diagnostics in pediatrics. The team of authors examined some of the most characteristic changes that distinguish the ECG in childhood.
A normal ECG in children differs from the ECG in adults and has a number of specific features in each age period. The most pronounced differences are observed in young children, and after 12 years, the child’s ECG approaches the cardiogram of an adult.
Features of heart rhythm in children
Childhood is characterized by a high heart rate (HR); newborns have the highest heart rate; as the child grows, it decreases. Children exhibit pronounced lability of heart rate; permissible fluctuations are 15–20% of the average age value. Sinus respiratory arrhythmia is often noted; the degree of sinus arrhythmia can be determined using Table 1.
The main pacemaker is the sinus node, however, acceptable variants of the age norm include the mid-atrial rhythm, as well as migration of the pacemaker through the atria.
Features of the duration of ECG intervals in childhood
Considering that children have a higher heart rate than adults, the duration of ECG intervals, waves and complexes decreases.
Changing the voltage of the QRS complex waves
The amplitude of the ECG waves depends on the individual characteristics of the child: tissue electrical conductivity, chest thickness, heart size, etc. In the first 5–10 days of life, a low voltage of the QRS complex waves is noted, which indicates reduced electrical activity of the myocardium. Subsequently, the amplitude of these waves increases. From infancy to 8 years, a higher amplitude of the waves is detected, especially in the chest leads, this is due to the smaller thickness of the chest, the larger size of the heart relative to the chest and the rotation of the heart around its axes, as well as a greater degree of fit of the heart to the chest. Features of the position of the electrical axis of the heart
In newborns and children in the first months of life, there is a significant deviation of the electrical axis of the heart (EOS) to the right (from 90 to 180°, on average 150°). From the age of 3 months. By the age of 1 year, in most children, the EOS moves to a vertical position (75–90°), but significant fluctuations in the angle are still allowed (from 30 to 120°). By 2 years, 2/3 of children still maintain the vertical position of the EOS, and 1/3 have a normal position (30–70°). In preschoolers and schoolchildren, as well as in adults, the normal position of the EOS predominates, but variants in the form of a vertical (more often) and horizontal (less often) position may be noted.
Such features of the position of the EOS in children are associated with changes in the ratio of masses and electrical activity of the right and left ventricles of the heart, as well as with changes in the position of the heart in the chest (rotations around its axes). In children in the first months of life, anatomical and electrophysiological predominance of the right ventricle is noted. With age, as the mass of the left ventricle increases rapidly and the heart rotates with a decrease in the degree of adhesion of the right ventricle to the surface of the chest, the position of the EOS moves from the right to the normogram. The changes that are occurring can be judged by the changing ratio of the amplitude of the R and S waves in the standard and chest leads on the ECG, as well as by the displacement of the transition zone. Thus, as children grow in standard leads, the amplitude of the R wave in lead I increases, and in lead III it decreases; the amplitude of the S wave, on the contrary, decreases in lead I and increases in lead III. In the chest leads, with age, the amplitude of the R waves in the left chest leads (V4-V6) increases and decreases in leads V1, V2; the depth of the S waves increases in the right chest leads and decreases in the left ones; The transition zone gradually shifts from V5 in newborns to V3, V2 after the 1st year. All this, as well as an increase in the interval of internal deviation in lead V6, reflects the increasing electrical activity of the left ventricle and rotation of the heart around its axes with age.
In newborn children, large differences are revealed: the electrical axes of the P and T vectors are located practically in the same sector as in adults, but with a slight shift to the right: the direction of the P vector is on average 55°, the T vector is on average 70°, while the QRS vector is sharply deviated to the right (on average 150°). The value of the adjacent angle between the electrical axes P and QRS, T and QRS reaches a maximum of 80–100°. This partly explains the differences in the size and direction of the P waves, and especially the T waves, as well as the QRS complex in newborns.
With age, the value of the adjacent angle between the electrical axes of the P and QRS, T and QRS vectors decreases significantly: in the first 3 months. life on average up to 40–50°, in young children – up to 30°, and in preschool age it reaches 10–30°, as in schoolchildren and adults (Fig. 1).
In adults and school-age children, the position of the electrical axes of the total vectors of the atria (vector P) and ventricular repolarization (vector T) relative to the ventricular vector (vector QRS) is in the same sector from 0 to 90°, and the direction of the electrical axis of the vectors P (on average 45 –50°) and T (on average 30–40°) does not differ sharply from the orientation of the EOS (QRS vector on average 60–70°). An adjacent angle of only 10–30° is formed between the electrical axes of the P and QRS, T and QRS vectors. This position of the listed vectors explains the same (positive) direction of the P and T waves with the R wave in most leads on the ECG. Features of teeth intervals and complexes of children's ECG
Atrial complex (P wave). In children, as in adults, the P wave is small (0.5–2.5 mm), with maximum amplitude in standard leads I and II. In most leads it is positive (I, II, aVF, V2-V6), in lead aVR it is always negative, in leads III, aVL, V1 it can be smoothed, biphasic or negative. In children, a slightly negative P wave in lead V2 is also allowed.
The greatest features of the P wave are observed in newborns, which is explained by increased electrical activity of the atria due to the conditions of intrauterine circulation and its postnatal restructuring. In newborns, the P wave in standard leads, compared to the size of the R wave, is relatively high (but in amplitude no more than 2.5 mm), pointed, and sometimes may have a small notch at the apex as a result of non-simultaneous coverage of the right and left atria by excitation (but not more than 0 .02–0.03 s). As the child grows, the amplitude of the P wave decreases slightly. With age, the ratio of the size of the P and R waves in standard leads also changes. In newborns it is 1: 3, 1: 4; as the amplitude of the R wave increases and the amplitude of the P wave decreases, this ratio by 1–2 years decreases to 1: 6, and after 2 years it becomes the same as in adults: 1: 8; 1: 10. The smaller the child, the shorter the duration of the P wave. It increases on average from 0.05 s in newborns to 0.09 s in older children and adults.
Features of the PQ interval in children. The duration of the PQ interval depends on heart rate and age. As children grow, there is a noticeable increase in the duration of the PQ interval: on average from 0.10 s (no more than 0.13 s) in newborns to 0.14 s (no more than 0.18 s) in adolescents and 0.16 s in adults (no more than 0.20 s).
Features of the QRS complex in children. In children, the time of ventricular excitation coverage (QRS interval) increases with age: on average from 0.045 s in newborns to 0.07–0.08 s in older children and adults.
In children, as in adults, the Q wave is recorded inconsistently, more often in II, III, aVF, left chest leads (V4-V6), less often in I and aVL leads. In lead aVR, a deep and wide Q wave of the Qr type or QS complex is detected. In the right chest leads, Q waves, as a rule, are not recorded. In young children, the Q wave in standard leads I and II is often absent or weakly expressed, and in children of the first 3 months. – also in V5, V6. Thus, the frequency of registration of the Q wave in various leads increases with the age of the child.
In standard lead III in all age groups, the Q wave is also small on average (2 mm), but can be deep and reach up to 5 mm in newborns and infants; in early and preschool age - up to 7–9 mm and only in schoolchildren it begins to decrease, reaching a maximum of 5 mm. Sometimes, in healthy adults, a deep Q wave is recorded in standard lead III (up to 4–7 mm). In all age groups of children, the size of the Q wave in this lead can exceed 1/4 of the size of the R wave.
In lead aVR, the Q wave has a maximum depth, which increases with the age of the child: from 1.5–2 mm in newborns to 5 mm on average (with a maximum of 7–8 mm) in infants and at an early age, up to 7 mm on average (with a maximum of 11 mm) in preschool children and up to 8 mm on average (with a maximum of 14 mm) in schoolchildren. The duration of the Q wave should not exceed 0.02–0.03 s.
In children, as well as in adults, R waves are usually recorded in all leads, only in aVR they can be small or absent (sometimes in lead V1). There are significant fluctuations in the amplitude of the R waves in different leads from 1–2 to 15 mm, but the maximum value of the R waves in standard leads is up to 20 mm, and in the chest leads up to 25 mm. The smallest magnitude of R waves is observed in newborns, especially in the strengthened unipolar and chest leads. However, even in newborns, the amplitude of the R wave in standard lead III is quite large, since the electrical axis of the heart is deviated to the right. After 1 month the amplitude of the RIII wave decreases, the size of the R waves in the remaining leads gradually increases, especially noticeably in the II and I standard and in the left (V4-V6) chest leads, reaching a maximum at school age.
In the normal position of the EOS, high R waves with a maximum of RII are recorded in all limb leads (except aVR). In the chest leads, the amplitude of the R waves increases from left to right from V1 (r wave) to V4 with a maximum of RV4, then decreases slightly, but the R waves in the left chest leads are higher than in the right ones. Normally, in lead V1, the R wave may be absent, and then a QS-type complex is recorded. In children, the QS type complex is also rarely allowed in leads V2, V3.
In newborns, electrical alternans is allowed - fluctuations in the height of the R waves in the same lead. Variants of the age norm also include respiratory alternation of ECG waves.
In children, deformation of the QRS complex in the form of the letters “M” or “W” in the III standard and V1 leads is often found in all age groups, starting from the neonatal period. In this case, the duration of the QRS complex does not exceed the age norm. Splitting of the QRS complex in healthy children in V1 is referred to as “slow excitation syndrome of the right supraventricular crest” or “incomplete block of the right bundle branch.” The origin of this phenomenon is associated with the excitation of the hypertrophied right “supraventricular scallop” located in the region of the conus pulmonary of the right ventricle, which is the last to be excited. The position of the heart in the chest and the electrical activity of the right and left ventricles changing with age are also important.
The internal deviation interval (time of activation of the right and left ventricles) in children changes as follows. The activation time of the left ventricle (V6) increases from 0.025 s in newborns to 0.045 s in schoolchildren, reflecting an accelerated increase in the mass of the left ventricle. The activation time of the right ventricle (V1) remains virtually unchanged with the child’s age, amounting to 0.02–0.03 s.
In young children, a change in the localization of the transition zone occurs due to a change in the position of the heart in the chest and a change in the electrical activity of the right and left ventricles. In newborns, the transition zone is located in lead V5, which characterizes the dominance of the electrical activity of the right ventricle. At the age of 1 month. the transition zone shifts to leads V3, V4, and after 1 year it is localized in the same place as in older children and adults - in V3 with fluctuations V2-V4. Together with an increase in the amplitude of the R waves and deepening of the S waves in the corresponding leads and an increase in the activation time of the left ventricle, this reflects an increase in the electrical activity of the left ventricle.
Both in adults and in children, the amplitude of the S waves in different leads varies widely: from absence in a few leads to a maximum of 15–16 mm, depending on the position of the EOS. The amplitude of the S waves changes with the age of the child. Newborn children have the smallest depth of S waves in all leads (from 0 to 3 mm), except standard I, where the S wave is quite deep (on average 7 mm, maximum up to 13 mm).
In children older than 1 month. the depth of the S wave in the first standard lead decreases and subsequently in all leads from the limbs (except aVR) S waves of small amplitude (from 0 to 4 mm) are recorded, just like in adults. In healthy children, in leads I, II, III, aVL and aVF, the R waves are usually larger than the S waves. As the child grows, there is a deepening of the S waves in the chest leads V1-V4 and in lead aVR, reaching a maximum value at high school age. In the left chest leads V5-V6, on the contrary, the amplitude of the S waves decreases, often they are not recorded at all. In the chest leads, the depth of the S waves decreases from left to right from V1 to V4, having the greatest depth in leads V1 and V2.
Sometimes in healthy children with an asthenic physique, with the so-called. “hanging heart”, S-type ECG is recorded. In this case, the S waves in all standard (SI, SII, SIII) and chest leads are equal to or exceed the R waves with reduced amplitude. It is believed that this is due to the rotation of the heart around the transverse axis with the apex posteriorly and around the longitudinal axis with the right ventricle forward. In this case, it is almost impossible to determine the angle α, so it is not determined. If the S waves are shallow and there is no shift of the transition zone to the left, then we can assume that this is a normal variant; more often, the S-type ECG is determined by pathology.
The ST segment in children, as well as in adults, should be on the isoline. The ST segment may shift up and down up to 1 mm in the limb leads and up to 1.5–2 mm in the chest leads, especially in the right ones. These shifts do not mean pathology if there are no other changes on the ECG. In newborns, the ST segment is often not expressed and the S wave, when reaching the isoline, immediately turns into a gently rising T wave.
In older children, as in adults, the T waves are positive in most leads (standard I, II, aVF, V4-V6). In standard III and aVL leads, T waves can be smoothed, biphasic or negative; in the right chest leads (V1-V3) are often negative or smoothed; in lead aVR – always negative.
The greatest differences in T waves are observed in newborns. In their standard leads, the T waves are low-amplitude (from 0.5 to 1.5–2 mm) or smoothed. In a number of leads, where T waves in children of other age groups and adults are normally positive, in newborns they are negative, and vice versa. Thus, in newborns there may be negative T waves in standard I, II, in strengthened unipolar and in the left chest leads; may be positive in standard III and right chest leads. By 2–4 weeks. life, an inversion of T waves occurs, i.e. in the I, II standard, aVF and left chest leads (except V4) they become positive, in the right chest and V4 - negative, in the III standard and aVL they can be smoothed, biphasic or negative.
In subsequent years, negative T waves persist in lead V4 until 5–11 years, in lead V3 – up to 10–15 years, in lead V2 – up to 12–16 years, although in leads V1 and V2 negative T waves are allowed in some cases and in healthy adults.
After 1 month During life, the amplitude of T waves gradually increases, amounting in young children from 1 to 5 mm in standard leads and from 1 to 8 mm in chest leads. In schoolchildren, the size of T waves reaches the level of adults and ranges from 1 to 7 mm in standard leads and from 1 to 12–15 mm in chest leads. The T wave is largest in lead V4, sometimes in V3, and in leads V5, V6 its amplitude decreases.
The QT interval (ventricular electrical systole) makes it possible to assess the functional state of the myocardium. The following features of electrical systole in children can be identified, reflecting the electrophysiological properties of the myocardium changing with age.
The duration of the QT interval increases as the child grows from 0.24–0.27 s in newborns to 0.33–0.4 s in older children and adults. With age, the relationship between the duration of electrical systole and the duration of the cardiac cycle changes, which is reflected by the systolic index (SP). In newborn children, the duration of electrical systole occupies more than half (SP = 55–60%) of the duration of the cardiac cycle, and in older children and adults – 1/3 or slightly more (37–44%), i.e., with age, SP decreases.
With age, the ratio of the duration of the electrical systole phases changes: the excitation phase (from the beginning of the Q wave to the beginning of the T wave) and the recovery phase, i.e., rapid repolarization (duration of the T wave). In newborns, more time is spent on recovery processes in the myocardium than on the excitation phase. In young children, these phases take approximately the same time. In 2/3 of preschoolers and most schoolchildren, as well as in adults, more time is spent on the arousal phase.
Features of ECG in different age periods of childhood
Newborn period (Fig. 2).
1. In the first 7–10 days of life, there is a tendency towards tachycardia (heart rate 100–120 beats/min), followed by an increase in heart rate to 120–160 beats/min. Pronounced heart rate lability with large individual fluctuations. 2. A decrease in the voltage of the QRS complex waves in the first 5–10 days of life with a subsequent increase in their amplitude. 3. Deviation of the electrical axis of the heart to the right (angle α 90–170°). 4. The P wave is relatively larger (2.5–3 mm) in comparison with the teeth of the QRS complex (P/R ratio 1: 3, 1: 4), often pointed. 5. PQ interval does not exceed 0.13 s. 6. The Q wave is unstable, as a rule, absent in standard I and in the right chest leads (V1-V3), it can be deep up to 5 mm in standard III and aVF leads. 7. The R wave in standard lead I is low, and in standard lead III it is high, with RIII > RII > RI, high R waves in aVF and right precordial leads. The S wave is deep in standard I, II, aVL and in the left precordial leads. The above reflects the deviation of the EOS to the right. 8. Low amplitude or smoothness of T waves in the limb leads is noted. In the first 7–14 days, the T waves are positive in the right chest leads, and in the I and left chest leads they are negative. By 2–4 weeks. life, an inversion of the T waves occurs, i.e. in the I standard and left pectorals they become positive, and in the right pectorals and V4 they become negative, remaining so in the future until school age.
Infant age: 1 month. – 1 year (Fig. 3).
1. Heart rate decreases slightly (on average 120–130 beats/min) while maintaining rhythm lability. 2. The voltage of the QRS complex teeth increases, often higher than in older children and adults, due to the smaller thickness of the chest. 3. In most infants, the EOS goes into a vertical position, some children have a normogram, but significant fluctuations in the α angle are still allowed (from 30 to 120°). 4. The P wave is clearly expressed in standard leads I and II, and the ratio of the amplitude of the P and R waves decreases to 1:6 due to an increase in the height of the R wave. 5. The duration of the PQ interval does not exceed 0.13 s. 6. The Q wave is recorded inconsistently and is often absent in the right precordial leads. Its depth increases in standard III and aVF leads (up to 7 mm). 7. The amplitude of the R waves in standard I, II and in the left thoracic (V4-V6) leads increases, and in standard III it decreases. The depth of the S waves decreases in standard I and in the left chest leads and increases in the right chest leads (V1-V3). However, in VI, the amplitude of the R wave, as a rule, still prevails over the magnitude of the S wave. The listed changes reflect the shift of the EOS from the correct position to the vertical position. 8. The amplitude of the T waves increases, and by the end of the 1st year the ratio of the T and R waves is 1: 3, 1: 4.
ECG in young children: 1–3 years (Fig. 4).
1. Heart rate decreases to an average of 110–120 beats/min, and in some children sinus arrhythmia appears. 2. The high voltage of the QRS complex teeth remains. 3. EOS position: 2/3 of children maintain a vertical position, and 1/3 have a normogram. 4. The ratio of the amplitude of the P and R waves in standard leads I and II decreases to 1: 6, 1: 8 due to the growth of the R wave, and after 2 years it becomes the same as in adults (1: 8, 1: 10) . 5. The duration of the PQ interval does not exceed 0.14 s. 6. Q waves are often shallow, but in some leads, especially in standard III, their depth becomes even greater (up to 9 mm) than in children of the 1st year of life. 7. The same changes in the amplitude and ratio of the R and S waves that were noted in infants continue, but they are more pronounced. 8. There is a further increase in the amplitude of the T waves, and their ratio with the R wave in leads I and II reaches 1: 3 or 1: 4, as in older children and adults. 9. Negative T waves remain (options: biphasic, smooth) in standard III and right chest leads up to V4, which is often accompanied by a downward shift of the ST segment (up to 2 mm).
ECG in preschool children: 3–6 years (Fig. 5).
1. Heart rate decreases to an average of 100 beats/min, and moderate or severe sinus arrhythmia is often recorded. 2. The high voltage of the QRS complex teeth remains. 3. EOS is normal or vertical, and very rarely there is a deviation to the right and a horizontal position. 4. PQ duration does not exceed 0.15 s. 5. Q waves in various leads are recorded more often than in previous age groups. The depth of the Q waves in standard III and aVF leads remains relatively large (up to 7–9 mm) compared to that in older children and adults. 6. The ratio of the size of the R and S waves in standard leads changes towards an even greater increase in the R wave in standard leads I and II and a decrease in the depth of the S wave. 7. The height of the R waves in the right chest leads decreases, and in the left chest leads it increases. The depth of the S waves decreases from left to right from V1 to V5 (V6). ECG in schoolchildren: 7–15 years (Fig. 6).
The ECG of schoolchildren is close to the ECG of adults, but there are still some differences:
1. Heart rate decreases on average in younger schoolchildren to 85–90 beats/min, in older schoolchildren – to 70–80 beats/min, but heart rate fluctuations within wide limits are noted. Moderate and severe sinus arrhythmia is often recorded. 2. The voltage of the QRS complex teeth decreases somewhat, approaching that of adults. 3. Position of the EOS: more often (50%) – normal, less often (30%) – vertical, rarely (10%) – horizontal. 4. The duration of ECG intervals approaches that of adults. The PQ duration does not exceed 0.17–0.18 s. 5. The characteristics of the P and T waves are the same as in adults. Negative T waves persist in lead V4 up to 5–11 years, in V3 – up to 10–15 years, in V2 – up to 12–16 years, although negative T waves in leads V1 and V2 are also allowed in healthy adults. 6. The Q wave is recorded inconsistently, but more often than in young children. Its value becomes smaller than in preschool children, but in lead III it can be deep (up to 5–7 mm). 7. The amplitude and ratio of the R and S waves in various leads approach those in adults. Conclusion
To summarize, we can highlight the following features of the children's electrocardiogram: 1. Sinus tachycardia, from 120–160 beats/min during the newborn period to 70–90 beats/min by high school age. 2. Greater variability of heart rate, often sinus (respiratory) arrhythmia, respiratory electrical alteration of QRS complexes. 3. The norm is considered to be mid- and lower-atrial rhythm and migration of the pacemaker through the atria. 4. Low QRS voltage in the first 5–10 days of life (low electrical activity of the myocardium), then an increase in the amplitude of the waves, especially in the chest leads (due to the thin chest wall and the large volume occupied by the heart in the chest). 5. Deviation of the EOS to the right up to 90–170º during the newborn period, by the age of 1–3 years – transition of the EOS to a vertical position, by adolescence in about 50% of cases – normal EOS. 6. Short duration of intervals and waves of the PQRST complex with a gradual increase with age to normal limits. 7. “Syndrome of delayed excitation of the right supraventricular crest” – splitting and deformation of the ventricular complex in the form of the letter “M” without increasing its duration in leads III, V1. 8. Pointed high (up to 3 mm) P wave in children in the first months of life (due to the high functional activity of the right side of the heart in the prenatal period). 9. Often – deep (amplitude up to 7–9 mm, more than 1/4 of the R wave) Q wave in leads III, aVF in children up to adolescence. 10. Low amplitude of T waves in newborns, increasing by the 2nd–3rd year of life. 11. Negative, biphasic or smoothed T waves in leads V1-V4, persisting until the age of 10–15 years. 12. Shift of the transition zone of the chest leads to the right (in newborns - in V5, in children after the 1st year of life - in V3-V4) (Fig. 2–6).
Bibliography
: 1. Heart disease: A guide for doctors / ed. R.G. Oganova, I.G. Fomina. M.: Litterra, 2006. 1328 p. 2. Zadionchenko V.S., Shekhyan G.G., Shchikota A.M., Yalymov A.A. Practical guide to electrocardiography. M.: Anaharsis, 2013. 257 pp.: ill. 3. Isakov I.I., Kushakovsky M.S., Zhuravleva N.B. Clinical electrocardiography. L.: Medicine, 1984. 4. Kushakovsky M.S. Cardiac arrhythmias. St. Petersburg: Hippocrates, 1992. 5. Orlov V.N. Guide to electrocardiography. M.: Medical Information Agency, 1999. 528 p. 6. Guide to electrocardiography / ed. h. Doctor of Science RF, prof. V.S. Zadionchenko. Saarbrucken, Germany. Lap Lambert Academic Publishing GmbH&Co. KG, 2011. P. 323. 7. Fazekas T.; Liszkai G.; Rudas LV Electrocardiographic Osborn wave in hypothermia // Orv. Hetil. 2000. Oct. 22.Vol. 141(43). P. 2347–2351. 8. Yan GX, Lankipalli RS, Burke JF et al. Ventricular repolarization components on the electrocardiogram: Cellular basis and clinical significance // J. Am. Coll. Cardiol. 2003. No. 42. P. 401–409.
PQ interval pathologies
Changes in the PQ interval indicate pathologies of the cardiac conduction system. This interval can be either shortened or lengthened. In some cases, there is dissociation of the P wave from the QRS complex.
A shortening of the interval indicates a faster than normal conduction of excitation from the atria to the ventricles. This can be dangerous due to the development of tachycardia attacks.
Lengthening the interval, on the contrary, indicates difficulty in conducting excitation between the atria and ventricles. These pathologies are called atrioventricular conduction blocks. They are classified as both physiological and pathological.
Pathologies of the PQ interval are fraught with the development of tachycardia
A shortening of the interval may indicate the presence of premature ventricular excitation syndrome. This syndrome is associated with the presence of additional (abnormal) pathways through which excitation from the atria reaches the ventricles. As a result, the impulse spreads without physiological delay, faster than necessary.
There are two types of this syndrome: CLC syndrome and WPW syndrome ; they can be differentiated from each other by the characteristics of the QRS complexes. You can recognize accelerated impulse conduction on an ECG by measuring the duration of the PQ interval. Its normal values should be less than 0.11 seconds.
The PQ interval on the ECG (the norm for children is less than for adults) during diagnosis depends on the age of the patients. With this pathology, the QRS complex and the T wave remain unchanged.
The danger of this phenomenon is the possibility of developing arrhythmias (paroxysmal tachycardias). During the course of the disease without attacks of tachycardia, the patient may not realize for a long time that there are additional pathways in the heart.
An increase in the interval may occur in cases of atrioventricular blockade. There are partial (types 1 and 2) and complete (type 3) blockades. The cause of blockades can be functional or organic factors.
Functional reasons include the use of certain medications that reduce intracardiac conduction and intense exercise. Examples of organic causes are myocardial infarction, infectious diseases of the heart muscle, myocardial ischemia and heart defects.
Intense sports may cause the development of PQ interval pathologies
The PQ interval on the ECG (the norm against the background of partial blockades is violated) in the first type increases, since the conduction of excitation is slowed down, but all impulses from the atria reach the ventricles. This type of blockade is physiological and is quite often observed in young patients and athletes.
Often this type of blockade has no clinical manifestations and does not affect people’s daily lives. On the ECG, this type of blockade manifests itself as an increase in the PQ interval (duration more than 0.2 s).
If a blockade of this type is detected, it is advisable to undergo additional examination to exclude the possibility of concomitant pathologies. Treatment is not prescribed until the factors that trigger the development of the pathology are identified.
PQ interval on ECG - pathologies
In the second type of disorder, not all impulses from the atria reach the ventricles. The ECG recording clearly shows that there are no QRS complexes following some P waves. There are two variants of the manifestation of the second type of blockade: Mobitz I and Mobitz II.
Syndrome and phenomenon of shortened PQ interval
The PQ interval is a purely electrocardiographic criterion that allows one to evaluate the transmission time of an electrical impulse from the sinus node in the atrium to the contractile fibers located in the ventricles. In other words, it reflects the operation of the atrioventricular junction, a kind of “switch” that redirects electrical excitation from the atria to the ventricles. Normally, it is no less than 0.11 seconds and no more than 0.2 seconds:
- An increase in the interval beyond the specified time indicates a slowdown in conduction through the atrioventricular node,
- Shortening means that the excitation is carried out too quickly. In fact, there is more frequent impulse of the ventricles, with the so-called “reset” of excitation.
The shortening of this interval is due to the presence of additional conduction bundles in the conduction system of the heart. It is through them that additional pulses are reset. Therefore, at certain moments the ventricles receive double impulses - physiological in a normal rhythm (60-80 per minute), and pathological, through bundles.
There may be several pathological bundles, and all of them are named after the names of the authors who first discovered them. Thus, the Kent and Maheim bundles are characteristic of the SVC syndrome, and the James bundles are characteristic of the CLC syndrome. In the first case, the pathological discharge of impulses goes from the atria directly to the ventricles, in the second, the James bundle passes through the atrioventricular node, that is, the node is stimulated first, and then the ventricles. Due to the “throughput” capacity of the AV node, part of the impulses conducted to the ventricles returns through the same bundle to the atria, therefore such patients have a high risk of developing paroxysmal supraventricular tachycardia.
What is the difference between a syndrome and a phenomenon?
Many patients, having seen the concepts of the phenomenon or CLC syndrome in the ECG conclusion, may be puzzled which of these diagnoses is worse. The CLC phenomenon, subject to a correct lifestyle and regular monitoring by a cardiologist, does not pose a great danger to health, since the phenomenon is the presence of signs of PQ shortening on the cardiogram, but without clinical manifestations of paroxysmal tachycardia.
CLC syndrome, in turn, is an ECG criterion accompanied by paroxysmal tachycardias, most often supraventricular, and can cause sudden cardiac death (in relatively rare cases). Typically, patients with short PQ syndrome develop supraventricular tachycardia, which can be quite successfully stopped at the stage of emergency medical care.
Why does short PQ syndrome occur?
As already indicated, the anatomical substrate of this syndrome in adults is a congenital feature, since additional conduction bundles are formed in the prenatal period . People with such bundles differ from ordinary people only in that they have an additional tiny “thread” in the heart, which takes an active part in conducting the impulse. But how the heart behaves with this beam will be discovered as the person grows and matures. For example, in children, CLC syndrome may begin to manifest itself both in infancy and adolescence, that is, during the rapid growth of the body. Or it may not manifest itself at all, remaining only an electrocardiographic phenomenon throughout adult life until old age.
No one can name the reason why the syndrome begins to manifest itself as paroxysmal tachycardia. However, it is known that in patients with organic pathology of the myocardium (myocarditis, heart attack, hypertrophic cardiomyopathy, heart disease, etc.) attacks of tachycardia occur much more often and clinically occur with a more pronounced clinical picture and with a severe general condition of the patient.
But the provoking factors that can cause paroxysm can be listed:
- Physical activity that is significantly or not significantly greater than the patient’s usual physical activity,
- Psycho-emotional stress, stressful situation,
- Hypertensive crisis,
- Eating large amounts of food at one time, drinking very hot or very cold liquids,
- Visiting a bathhouse, sauna,
- Changes in external temperatures, for example, going out into severe frost from a very hot room,
- Increased intra-abdominal pressure, for example, during severe coughing, sneezing, defecation, pushing during childbirth, lifting heavy objects, etc.
How does short PQ syndrome manifest?
The clinical picture of shortened PQ syndrome is caused by the occurrence of paroxysmal tachycardia, since during the interictal period the patient usually does not present any complaints from the cardiovascular system. Symptoms of tachycardia are the following:
- The sudden, sharp onset of an attack, caused by provoking factors or occurring without them, in itself,
- Feeling of a strong heartbeat, sometimes with a feeling of interruptions in the heart,
- Autonomic manifestations - severe weakness, hyperemia or paleness of the face, sweating, coldness of the extremities, fear of death,
- Feeling of suffocation or lack of oxygen, feeling of insufficient inspiration,
- Unpleasant discomfort in the heart area of a pressing or burning nature.
If the symptoms described above appear, you should definitely seek medical help by calling an ambulance or going to a clinic.
Diagnosis of shortened PQ
The diagnosis is established after recording an ECG and interpreting its data by a doctor. The main ECG signs of CLC syndrome:
- Increased heart rate - 100-120 per minute or more, sometimes reaching 200 beats per minute,
- Shortening of the PQ interval between the P wave and the ventricular QRST complex is less than 0.11-0.12 seconds,
- Unchanged ventricular complexes in case of supraventricular tachycardia, and dilated, deformed - in case of ventricular tachycardia, which is a life-threatening condition,
- Correct sinus rhythm in supraventricular tachycardia.
- After the diagnosis has been established and the paroxysm has been relieved, the patient is prescribed an additional examination to exclude gross cardiac pathology (heart defects, myocarditis, heart attack, etc.). Of these, the use of the following is justified:
- Ultrasound of the heart,
- Installation of an ECG monitor during the day,
- Examination of the electrocardiogram after physical activity (stress tests using bicycle ergometry, treadmill, tests with a load of pharmacological drugs),
- TEE, or transesophageal electrophysiological study and electrical stimulation of the heart muscle by inserting a probe into the esophagus,
- In especially unclear clinical cases, endovascular or intravascular EPI (endoEPI). The plan for further examination and treatment of the patient is determined only by the attending physician. Treatment of shortened PQ syndrome
- The shortened PQ phenomenon, also called the CLC phenomenon, does not require treatment. It is quite enough to correct the lifestyle and undergo regular examinations with a doctor - a cardiologist or arrhythmologist, for a child - once every six months, for adults - once a year.
- Treatment of shortened PQ syndrome (CLC - Clerk-Levi-Christesco syndrome) consists of providing first aid at the time of tachycardia paroxysm and further taking prescribed medications. First aid can be provided by the patient independently - this is the use of vagal tests. These manipulations are based on a reflex effect on the vagus nerve, which slows down the heart rate. Vagal tests can be used at the time of paroxysm only if the patient has had an attack of tachycardia not for the first time, he has been diagnosed and has not previously had ventricular tachycardia. In addition, vagal tests should be explained to the patient in detail by the doctor. The most effective techniques include the following:
- Straining test (Valsalva maneuver),
- Simulating a cough or sneeze
- Lowering your face into a basin of cold water, holding your breath,
- Finger pressure with moderate force is applied to the closed eyeballs for three to five minutes. Restoration of the correct heart rhythm is carried out by a doctor or paramedic and is carried out by administering medications intravenously. As a rule, this is asparkam, verapamil or betaloc. After hospitalization of the patient in a cardiology hospital, treatment of the underlying heart disease, if any, is carried out. In the case of frequent attacks of tachyarrhythmia (several per month, per week), as well as a history of ventricular arrhythmias, a hereditary history of sudden cardiac death or death from cardiac causes in young people, the patient is indicated for surgical treatment. The operation involves applying radio frequencies, a laser or a cold factor to an additional beam. Accordingly, radiofrequency ablation (RFA), laser destruction or cryo-destruction are performed. All indications and contraindications are determined by an arrhythmologist, cardiologist and cardiac surgeon. Many patients are interested in the possibility of permanent cardiac pacing. An pacemaker can be installed if the patient has a tendency to paroxysmal ventricular tachycardia, ventricular fibrillation and there is a high risk of clinical death with cardiac arrest (asystole). Then you can consider installing a cardioverter-defibrillator, which, unlike an artificial pacemaker, does not impose the correct rhythm, but “restarts” the heart when such fatal arrhythmias occur. Is it possible to develop complications with PQ shortening? The phenomenon of shortened PQ does not lead to any complications can not. Due to the fact that the manifestation of PQ syndrome is an attack of tachyarrhythmia, there will be corresponding complications. These include the occurrence of sudden cardiac death, fatal arrhythmias (ventricular fibrillation), thromboembolism of the cerebral and pulmonary arteries, the development of myocardial infarction, arrhythmogenic shock and acute heart failure. Of course, not every patient develops such complications, but everyone needs to remember them. Prevention of complications is timely seeking medical help, as well as timely surgery if indications for it are discovered by a doctor. Prognosis Determining the prognosis for patients with CLC syndrome is always difficult, since it is not possible to predict in advance the occurrence of certain rhythm disturbances, the frequency and conditions of their occurrence, as well as the appearance of their complications. According to statistical data, the life expectancy of patients with shortened PQ syndrome is quite is high, and paroxysmal arrhythmias most often occur in the form of supraventricular rather than ventricular tachycardias. However, in patients with underlying heart pathology, the risk of sudden cardiac death remains quite high. The prognosis regarding the phenomenon of shortened PQ remains favorable, and the quality and life expectancy of such patients do not suffer. Prepared by cardiorheumatologist RNPCSM Taraleva T.A.
Mobitz I
This type of blockade of the second type can be physiological for young people and athletes. On the ECG it appears as an increase in the PQ interval with each contraction. The interval increases until the atrial impulse is blocked (this is shown on the cardiogram as the absence of the QRS complex).
Also, as with the first type of blockade, patients may not suspect the presence of disturbances in the conduction system of the heart and may not experience any clinically manifested symptoms.
If a second-degree block of Mobitz type I is detected, a re-examination should be carried out , including 24-hour heart rate monitoring and a repeat electrocardiogram. Treatment is prescribed after identifying the cause of the blockade.
Mobitz II
This type is always pathological. The pulse travel time is constant, but the pulses are periodically blocked. This is reflected as the absence of some QRS complexes. Most often, a violation of the passage occurs on every third (3:1) or fourth (4:1) excitation. In severe cases, the blockade occurs every second contraction (2:1).
The condition of patients with this pathology can be very different. Some patients note a sharp deterioration in their condition, darkening of the eyes, coinciding with the loss of the QRS complex. A number of patients may not even be aware of the presence of these problems.
The severity of the blockade and the risk of transition to a complete blockade (third degree blockade) depends on the causes of the development of the pathology. Treatment is also prescribed based on the etiology of the disease. Blockade of the third type is characterized by complete disruption of impulse conduction. On the cardiogram, this appears as a separation between the P waves and the QRS complexes.
Cardiac activity in such patients is maintained by the rhythm generated by the ventricles. Depending on the cause of the development of third-degree blockade, treatment methods can be either medicinal or surgical (implantation of a pacemaker). If this type of block is congenital, most patients do not require a pacemaker.
Disturbances in the conduction system of the heart can cause sudden cardiac arrest and death. These disorders can be either congenital or acquired.
In the case of acquired diseases, early diagnosis and correctly prescribed treatment can affect a favorable outcome of the disease. That is why an ECG should be performed periodically to make sure that its indicators (in particular the PQ interval) are normal.
Materials for electrocardiography analysis
Options for changing the
U
Pronounced
U .
This variant may be associated with hypokalemia.
Negative
U .
Wave inversion may be a manifestation of heart disease.
Options
QT
interval Prolonged
QT .
It indicates prolongation of ventricular repolarization, which indicates a longer period of relative refractoriness.
Prolongation of the QT interval can be congenital or familial. It may also be a consequence of the use of medications, especially type I antiarrhythmic drugs. Most commonly seen in myocardial ischemia or infarction, a prolonged QT interval may indicate a life-threatening ventricular arrhythmia (eg, torsade de pointes). Shortened QT .
May be due to hypercalcemia or toxic effects on the myocardium of cardiac glycosides.
Options for changing the
T
Negative wave
T.
Considered normal in lead aVR. In leads III ,
Vx and V2, both negative and positive T waves are considered normal. However, a negative T wave in leads I,
II ,
V35 or V6 may indicate myocardial ischemia.
Pointed T wave.
Also known as tenting, the T wave indicates hyperkalemia or myocardial ischemia.
Heavily serrated T wave.
In children, severe is a variant of the norm; in adults, it may indicate the presence of pericarditis.
High or low T wave.
Occurs with electrolyte disturbances.
T wave
bulges.
The P wave may be hidden within the T wave. When this occurs, atrial depolarization occurs, indicating that the impulse is originating from a location above the ventricles.
Options for changing the
ST
ST segment elevation .
Segment elevation of 0.2 mV or greater above centerline indicates myocardial injury.
Decreased
ST .
Indicates myocardial injury or ischemia.
ST segment changes .
May occur with pericarditis, myocarditis, left ventricular hypertrophy, pulmonary embolism and electrolyte disturbances. These changes can also be observed in patients taking drugs that disrupt the processes of depolarization and repolarization, such as antiarrhythmic drugs (amiodarone).
Options for changing
QRS
complex Extended
QRS
(more than 0.12 s). Such a complex can be observed in conditions with slow conduction of the impulse to one of the ventricles (bundle branch block) and conditions in which the impulse is formed in the ventricles (premature contraction of the ventricles, idioventricular rhythms and ventricular tachycardia).
Variants of the shape of the
QRS .
Impaired intraventricular conduction will be reflected in the shape of the QRS complex. With a bundle branch block, for example, an additional R wave, designated R', or an additional S wave, designated S', may appear.
Varying
QRS .
If the amplitude and outline of the complex varies from cycle to cycle, this indicates the presence of an ectopic or aberrant source of impulses.
Dropped
QRS .
If the QRS complex does not appear after each P wave, conditions in which ventricular depolarization does not occur (AV block or ventricular asystole) should be suspected.
Options for changing the
PR
Shortened
PR .
This option indicates that the impulse originates somewhere other than the SA node. A shortening of the interval is characteristic of atrioventricular arrhythmia and premature ventricular excitation syndrome.
Extended
PR .
A lengthening of the interval indicates that there is a delay in the passage of the impulse through the AV node. This is accompanied by atrioventricular block of the first or second degree.
Options for changing the P wave
Pointed R wave.
An increase in the amplitude of the P wave can be observed with hypertrophy of the right atrium.
Wide double-humped R wave.
Observed in left atrial hypertrophy, this wave may appear in leads I, II, III and aVF. The first peak indicates depolarization of the right atrium, the second - depolarization of the left atrium.
Inverted P wave.
Inversion in all leads except aVR may indicate that the SA node is not a pacemaker and that the electrical impulse through the atrium is traveling in the opposite direction. An inverted P wave is usually found in atrioventricular arrhythmias. All cases where the positive sinus P wave suddenly becomes inverted indicate retrograde propagation of the electrical impulse.
Variable R wave.
If the shape and size of the P wave varies, this means that impulses can occur in different places, as in an atopic rhythm. Other reasons for this phenomenon may be increased excitability of the atrium tissue and the lesion localized near the SA node.
Prolapsed R wave.
If the P wave does not precede every QRS complex, this may indicate third-degree AV block or output block.