Blood gases affect pH
Despite the fact that the study of the acid-base status, strictly speaking, implies the study of only the pH (concentration of H + ions), in reality it also includes the study of physiologically important gases present in the blood - O2 and CO2. Gas analysis shows the efficiency of gas exchange by the values of partial pressures - pO2 and pCO2 .
Molecules of any gases move diffusely through the alveolar membrane along a concentration gradient. O2 molecules of atmospheric air flow from the alveoli into the blood, and CO2 molecules from the blood into the alveoli until their partial pressures are equalized.
The partial pressure is the percentage of gas in the total volume.
Carbon dioxide
The concentration of CO2 in the alveolar air is so low and in the blood so high that the diffusion of this gas into the alveoli is extremely effective and the rate of its removal depends only on alveolar ventilation - the total volume of air transported per minute between the alveoli and a).
Hence,
- With increased ventilation of the lungs, carbon dioxide is quickly eliminated, and the pCO2 in the blood decreases . This means the body loses carbonic acid (H+ ions), which causes alkalization of the blood - alkalosis , called respiratory or respiratory .
- with insufficient alveolar ventilation, the pCO2 value increases, which indicates insufficient removal and accumulation of H2CO3. In other words, an increase in pCO2 in the blood is the cause of respiratory acidosis.
Increased pCO2 (hypercapnia) always indicates a decrease in alveolar ventilation.
Oxygen
Issues related to blood oxygenation and oxygen transport are more complex. This is due to the fact that only a small fraction of the total oxygen in the blood is found in the form of free (dissolved) O2 molecules. The main part of oxygen is associated with hemoglobin (oxyhemoglobin) and the true oxygen content depends on two additional parameters - Hb concentration and saturation (saturation) of hemoglobin with oxygen.
Oxyhemoglobin
Oxyhemoglobin (HbO2) – percentage in the blood, is the ratio of the oxyhemoglobin fraction (HbO2) to the sum of all fractions (total hemoglobin).
Hemoglobin oxygen saturation
Hemoglobin oxygen saturation (HbOSAT, SO2) is the ratio of the fraction of oxygenated hemoglobin to the amount of hemoglobin in the blood that is capable of transporting O2.
The differences between the two indicators HbO2 and HbOSAT are that patients may have a form of hemoglobin in their blood that is not capable of accepting O2 (Hb‑CO, metHb, sulfoHb). But since most patients do not have elevated levels of these forms of hemoglobin in their blood, the values of HbO2 and SO2 are usually very close.
For example, if in case of nitrite poisoning the amount of metHb is 15%, then the HbO2 value can never exceed 85%, but the saturation (HbOsat) can be different - from a maximum (HbOsat = 95-98%) with full saturation to low values in the absence of oxygen .
The oxygen saturation index shows the percentage of available binding sites on hemoglobin.
Illustration of the concepts of oxyhemoglobin (HbO2) and hemoglobin saturation (HbO2sat)
Partial pressure of oxygen (pO2)
The partial pressure of O2 acts as the driving force leading to the saturation of hemoglobin with oxygen. And although, as a rule, the higher the pO2, the higher the HbOsat, this relationship is not linear.
Hemoglobin dissociation curve under normal conditions and with changes in pH and 2,3-diphosphoglycerate concentration
In the central part of the hemoglobin saturation curve (or dissociation curve), the slightest shifts in pO2 lead to sharp changes in hemoglobin saturation. Conversely, at high pO2 (80-90-100 mmHg) the curve becomes flat, hemoglobin saturation depends little on fluctuations in oxygen in the plasma.
A shift to the left occurs with alkalization and a decrease in the concentration of 2,3-diphosphoglycerate and signals an increase the affinity of oxygen for hemoglobin (in the lungs). A shift to the right is a decrease in the affinity of oxygen for hemoglobin (in tissues), which is ensured by acidification of the environment and the accumulation of 2,3-diphosphoglycerate.
The pO2 value does not reflect the oxygen content of whole blood! But although pO2 does not indicate the total amount of oxygen in the blood, this total amount depends on pO2 through the hemoglobin saturation indicator.
In turn, there are factors that influence the pO2 value:
1. Alveolar ventilation . Although it affects both pO2 and pCO2, the proportion of oxygen in the alveoli during hyperventilation can only slightly increase, approaching the pO2 of atmospheric air; during hypoventilation, it rapidly falls, being replaced by CO2 coming from the blood. At the same time, the proportion of CO2 in the alveoli decreases rapidly with increased ventilation.
2. Ventilation-perfusion ratio is determined by the fact that
- not all the blood flowing to the lungs comes into contact with the well-ventilated alveoli (collapse of the alveoli, hardening of the wall).
- not all well-ventilated alveoli receive enough blood (right ventricular heart failure).
3. Oxygen concentration in inspired air (FiO2, fraction of inspired oxygen).
The table shows comparative values for the concentrations of oxygen and carbon dioxide in the air, blood and tissues. It is necessary to pay attention to changes in the concentrations of oxygen and carbon dioxide in the blood and alveolar air. An important feature is that pO2 in alveolar air and arterial blood are very close, i.e. Under normal conditions, deep and/or frequent breathing cannot increase oxygen consumption and saturation of hemoglobin. At the same time, the difference in pCO2 concentrations in venous blood and alveolar air allows it to be effectively removed with frequent breathing.
| pO2, mm Hg | pCO2, mm Hg | |
| Inhaled air | 159 | 0,23 |
| Alveolar air | 105-110 | 40 |
| Arterial blood | 83-108 | 35-45 |
| Fabrics | 10-20 | 50-60 |
| Deoxygenated blood | 35-49 | 46-51 |
| Exhaled air | 116 | 32 |
0
What is FiO2?
FiO2 (Fraction of Inspired Oxygen) is the fraction of oxygen in the inhaled gas mixture. As you know, natural air contains 21% oxygen, 78% nitrogen and 1% other gases such as argon, carbon dioxide, neon, helium, methane, hydrogen and xenon. Thus, the FiO2 indicator of air is 0.21. Outside of anesthesiology-critical care departments, FiO2 has historically received little attention. But the Covid-19 pandemic has changed our lives.
In critically ill patients, FiO2 is used to assess the gas exchange capacity of the lungs using the PaO2/FiO2 ratio (oxygenation index). In this case, the degree of acute respiratory distress syndrome is classified as mild (PaO2/FiO2 from 201 to 300 mm Hg), moderate (PaO2/FiO2 from 101 to 200 mm Hg) and severe (<100 mm Hg .), more details here
There has been much controversy regarding the use of high FiO2 during anesthesia . It was previously hypothesized that perioperative oxygen would reduce the risk of surgical site infections, the incidence of atelectasis and myocardial infarction, and ICU admission. The World Health Organization, in addition to several meta-analyses, has shown no benefit for perioperative hyperoxia. According to prof. Likhvantseva V.V., during low-flow anesthesia with inhalational anesthetics, FiO2 should be 60%.
To understand FiO2, it is important to understand several terms:
- SpO2 – saturation
- hypoxemia – decreased partial pressure of oxygen in the blood
- PaO2 – partial pressure of oxygen in arterial blood, measured from an arterial blood gas sample
- PAO2 – partial pressure of oxygen in the alveoli
Understanding oxygen delivery and interpreting FiO2 values is absolutely essential for the proper management of patients with hypoxemia. Hypoxemia, especially in critically ill patients, has been shown to increase all-cause mortality. When oxygen delivery and consumption are mismatched, cell damage and death occurs.
The amount of oxygen inhaled, i.e. FiO2 is not equivalent to oxygen, which participates in gas exchange at the alveolar level. There is an equation that takes into account barometric pressure (P), water vapor pressure (P) and gas exchange coefficient (Rq). Partial pressure of alveolar oxygen (PAO2) = [{P (ATM) - P (H2O} FiO2] - [PaCO2 / Rq]]. From this direct relationship, it can be assumed that as FiO2 increases, PaO2 should also increase. An alternative to calculating alveolar oxygen saturation is SpO2, i.e. oxygen saturation obtained using pulse oximetry.
How is the procedure done?
There is no special preparation for the procedure. Patients are not given any restrictions on drinking or eating before the test. The oxygen concentration should remain constant for 20 minutes before analysis; if the test is to be performed without oxygen saturation, the gas should be turned off for 20 minutes before the test is performed. The patient should breathe normally during the test. A blood sample is obtained by arterial puncture (usually in the wrist, although it can be done in the groin or arm). If a puncture is required, the skin over the artery is cleaned with an antiseptic. The healthcare professional then collects the blood using a small, sterile needle attached to a disposable syringe. The patient may feel a short pulsation or cramp at the puncture site. Once the material has been collected, it should be transported to the laboratory for analysis as soon as possible.
After the blood has been drawn, the doctor or patient presses cotton wool against the puncture site for 10-15 minutes to stop the bleeding, and then wraps it tightly with a bandage. The patient should rest quietly after completing the procedure. Health care providers will watch for signs of bleeding or circulation problems. The risks of getting them when the test is performed correctly are very low. Includes bleeding or bruising at the site of blood donation or after some time. Very rarely there may be a problem with circulation in the puncture area.
Methodological manual on pulse oximetry. Part 1
This article presents information from a manual on pulse oximetry: “Diagnostic capabilities of non-invasive monitoring of arterial blood hemoglobin oxygen saturation in the clinic of internal diseases: method.recommendation. / D.V. Lapitsky [and others]. – Minsk: BSMU, 2015. – 71 p.”
Intended for doctors of therapeutic specialties, 5th-6th year students of the Faculty of Medicine, clinical residents, interns.
1. Basics of the pulse oximetry method.
In the physiology of respiration, it is customary to distinguish two key processes: cellular (tissue) respiration and external respiration (gas exchange) [1,2]. Cellular respiration is the process by which the cell releases energy from carbohydrates, fats and proteins [3]. External respiration ensures the supply of oxygen to the body for use in the biological oxidation of organic substances (i.e., in the process of cellular respiration), and the removal of the product of this oxidation, carbon dioxide, from the body. Thus, arterial blood can be represented as a link between external and internal respiration. The gas composition of arterial blood reflects the efficiency of external respiration and allows us to indirectly predict the risk of developing tissue hypoxia. Based on these positions, the diagnostic value of assessing the gas composition of arterial blood becomes clear.
The study of the gas composition of alveolar gas and arterial blood was initiated by the English physiologist John Scott Haldane at the beginning of the 20th century. Advances in science and technology over the past century have made it possible to formulate a coherent theory of gas exchange and to design instruments (for example, Radiometer Medical ApS, Denmark) for determining gases in samples of exhaled air, arterial and venous blood [4,5]. However, this examination requires stationary equipment and is invasive.
For the needs of practical and applied medicine, a method for quickly and non-invasively assessing the oxygen status of arterial blood is required. The search for such a method has been carried out since the 30s of the 20th century. In 1940, the first hemoximeter was designed to detect hypoxemia in pilots during flight. The developed equipment was bulky and required complex maintenance. These circumstances were the reason for the limited use of hemoximeters in clinical practice. The development of technology made it possible already in 1975 to launch the first mobile non-invasive pulse oximeter on the market, allowing long-term monitoring of arterial blood hemoglobin oxygen saturation.
The pulse oximetry method is based on two key physiological phenomena:
- The ability of hemoglobin, depending on its oxygenation, to absorb light of a certain wavelength to varying degrees when this light passes through a section of tissue (oximetry).
- Ripple of arteries and arterioles in accordance with the stroke volume of the heart (pulse wave).
The principle of oximetry is as follows. Deoxyhemoglobin (non-oxygen hemoglobin - RHb) absorbs red light intensely and weakly blocks infrared light. Oxyhemoglobin (fully oxygenated hemoglobin, each molecule of which contains four molecules of oxygen - HbO2) absorbs infrared radiation well, weakly retaining red radiation. Based on the ratio of red (R) and infrared (IR) fluxes that reached the photodetector from the radiation source through a section of tissue (for example, earlobe, finger), the degree of saturation of blood hemoglobin with oxygen is determined - saturation, SO2 (Fig. 1).
Rice. 1 The principle of oximetry (explanations in the text).
A pulse wave is formed as a result of pulsation of arteries and arterioles caused by the release of a certain volume of blood (stroke volume) into the aorta by the left ventricle. Each pulse wave leads to a rhythmic, in time with the heartbeat, change in blood supply to the tissue area under study. The result of recording such fluctuations in blood supply is a photoplethysmogram (PPG). PPG analysis allows you to determine the heart rate and assess the quality of peripheral blood flow (Fig. 2). In various clinical situations, the PPG amplitude can change tens of times. PPG allows you to get a fairly accurate impression of local blood flow. A decrease in PPG amplitude is a sign of peripheral vasoconstriction and/or a decrease in stroke volume, while an increase in amplitude indicates the opposite. Vascular tone is the main factor determining the height of PPG waves.
Rice. 2 Photoplethysmogram.
Another important advantage of recording a photoplethysmogram is the ability to isolate the portion of the intensity of the light flux that is absorbed directly by hemoglobin in arterial blood. When light passes through a section of tissue, it encounters various obstacles, which can be divided into several layers (Fig. 3). Layer 1 is tissue (skin, subcutaneous tissue, nail, bone), layer 2 is capillary and venous blood, layer 3 is blood remaining in the arterioles at the end of each pulsation, a kind of “end-systolic volume” of the arterial bed, layer 4 - additional volume of arterial blood flowing into the arterioles during cardiac systole.
Rice. 3 Absorption of light fluxes from LEDs by various tissues (explanation in the text).
At the moment preceding cardiac contraction, the weakening of light fluxes is due to the first three layers: radiation falls on the photodiode, which is regarded as background. When the next pulse wave reaches the arteries, the volume of blood in them increases and the absorption of light changes. At the peak of the pulse wave, the difference between the background and current radiation becomes maximum. The photodetector measures this difference and believes that it is caused by the additional amount of arterial blood that appears in the path of the radiation. This information is sufficient to use a special algorithm to calculate the degree of oxygen saturation of hemoglobin in arterial blood - SaO2, which is designated as SpO2 when measured with a pulse oximeter.
Thus, the use of one measurement principle (tissue transillumination) allows one to determine three diagnostic parameters at once: the degree of oxygen saturation of hemoglobin in arterial blood (SpO2), heart rate, and the volumetric amplitude of blood filling of a tissue area. Since the measurement is carried out by transilluminating tissue, this method is called “transmission pulse oximetry”. The vast majority of pulse oximeters used in medical practice operate based on this method.
Medical personnel who use pulse oximeters in daily activities need to be aware of the disadvantages and limitations of the pulse oximetry method. Pulse oximetry is an indirect method of assessing ventilation and does not provide information on the pH level, oxygen tension (PaO2) and carbon dioxide (PaCO2) in arterial blood. For practical work, it is useful to know that SpO2 indicators correlate with the partial pressure of oxygen in the blood: a decrease in PaO2 entails a decrease in SpO2. This dependence is nonlinear, which is explained by the S-shaped shape of the oxyhemoglobin dissociation curve (Fig. 4):
- 80-100 mm Hg. Art. PaO2 corresponds to 95–100% SpO2;
- 60 mmHg Art. PaO2 corresponds to 90% SpO2;
- 40 mmHg Art. PaO2 corresponds to 75% SpO2.
In addition, a number of factors can have a negative impact on the accuracy of measurements:
- bright external light and movements may interfere with the operation of the device;
- incorrect placement of the sensor: for transmission oximeters it is necessary that both parts of the sensor are symmetrical relative to the area of tissue being illuminated, otherwise the path between the photodetector and the LEDs will be unequal, and one of the wavelengths will be “overloaded”;
- a significant decrease in peripheral tissue perfusion leads to a decrease or disappearance of the pulse wave. In this situation, the SpO2 measurement error increases;
- at SaO2 values below 70%, the error in saturation measurements using pulse oximetry – SpO2 – also increases. In this regard, it should be noted that in the practical work of a physician in a therapeutic specialty, the probability of encountering SaO2 values below 70% in a patient is extremely low;
- anemia requires higher levels of oxygen to support oxygen transport. With hemoglobin values below 50 g/l, 100% blood saturation can be observed even with a lack of oxygen;
- carbon monoxide poisoning (high concentrations of carboxyhemoglobin can give a saturation value of about 100%);
- dyes, including nail polish, can cause an underestimated saturation value;
- cardiac arrhythmias may interfere with the pulse oximeter's perception of the pulse signal;
- age, gender, jaundice and dark skin color do not affect the operation of the pulse oximeter.
It is the simplicity and non-invasiveness of assessing the quality of peripheral blood flow and oxygen saturation of hemoglobin in arterial blood, as well as the ability of monitor systems to conduct arbitrary long-term monitoring of these parameters, that have contributed to the spread of the pulse kimetry method in departments of anesthesiology and intensive care/resuscitation for monitoring patients in severe conditions. At the same time, specially developed algorithms suppress excessive tissue pulsation, tissue scattering of the light flux and reduce the influence of external lighting and other artifacts on the device readings, making the readings reliable and suitable for systematic analysis.
2. Parameters of arterial blood oxygenation.
The quality of arterial blood oxygenation is assessed by the following indicators [6,7]:
1. PaO 2
– oxygen tension in arterial blood, mm Hg.
Art. PaO2 is the pressure required to keep oxygen in the arterial blood dissolved. The higher this indicator, the more oxygen is contained in the blood and the higher the pressure gradient, which determines the rate of movement of oxygen from capillary blood into tissues. Normally, PaO2 is 92-98 mm Hg. Art. and is measured in laboratory conditions in a microsample of arterial blood;
2. SaO 2
– degree of oxygen saturation of hemoglobin in arterial blood, %.
SaO2 depends on PaO2. The relationship between PaO2 and SaO2 is regulated by several physiological factors (carbon dioxide tension in arterial blood - PaCO2, blood acidity - pH, body temperature, etc.) and is expressed by an S-shaped oxyhemoglobin dissociation curve (Fig. 4). Normal values for this indicator are 95–99% and can be obtained in a microsample of arterial blood. This parameter is measured by a pulse oximeter. It is designated SpO2.
3. P 50
– blood oxygen tension at its half-saturation with oxygen (SO 2 = 50%), mm Hg.
Art. This indicator is determined in a microsample of arterial blood and reflects the affinity of hemoglobin for oxygen. Normal values for this indicator are 26 – 27 mmHg. Art. A decrease in the P50 value corresponds to a shift of the oxyhemoglobin dissociation curve to the left and, accordingly, an increase in the affinity of hemoglobin for oxygen; an increase in P50 indicates a shift of the oxyhemoglobin dissociation curve to the right with a decrease in the affinity of hemoglobin for oxygen (Fig. 4).
4. CaO 2
– oxygen capacity of the blood, reflecting the amount of oxygen in arterial blood, ml/l.
As a rule, this indicator is obtained by calculation. Oxygen is contained in the blood in a dissolved state and in a reversible connection with hemoglobin. The solubility constant of oxygen in arterial blood is 0.031 ml for every 1 mmHg. Thus, the product - 0.031 × PaO2 - represents the amount of oxygen dissolved in arterial blood. One gram of fully oxygenated hemoglobin contains 1.39 ml of oxygen. However, taking into account the correction for pathological hemoglobins (carboxyhemoglobin, methemoglobin), this figure is taken as 1.34 ml/g. The amount of oxygen attached to hemoglobin (Hb) is calculated as 1.34×Hb×SaO2/100 (ml/l). Thus, the oxygen capacity of arterial blood is equal to:
(*) CaO 2
(ml/l) = 1.34 × Hb × SaO 2 /100 + 0.031 × PaO 2 .
Normal values for this indicator are 180 – 204 ml/l.
CaO2 can be estimated using SpO2 values. Due to the fact that the pulse oximetry method does not allow estimating PaO2, the second component of the right side of the equation (*) - 0.031×PaO2 - is ignored. At the same time, CaO2 will decrease insignificantly – from 1.5 to 3.0 ml/l. Thus, equation (*) for a pulse oximeter is written:
CaO 2
(ml/l) = 1.34 × Hb × SaO 2 /100.
Rice. 4. Oxyhemoglobin dissociation curve.
Go to part two
Partial pressure of oxygen in arterial and venous blood
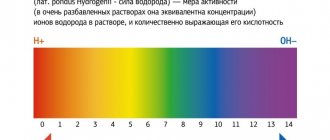
Acidity indicator (pH): changes in the concentration of hydrogen ions reflect either a normal blood reaction, or an acidic or alkaline reaction. Normal pH value = 7.36 –7.44.
PaCO2 is the partial pressure of carbon dioxide in arterial blood. This is the respiratory component of acid-base regulation. It depends on the frequency and depth of breathing (or the adequacy of mechanical ventilation). Hypercapnia (PaCO2 > 45 mmHg) is a consequence of alveolar hypoventilation and respiratory acidosis. Hyperventilation leads to hypocapnia - a decrease in partial pressure of CO2 below 35 mmHg and respiratory alkalosis
PaO2 is the partial pressure of oxygen in arterial blood. This value does not play a primary role in the regulation of CBS if it is within normal limits (at least 80 mmHg).
SpO2 – saturation of hemoglobin in arterial blood with oxygen.
BE (ABE) – base deficiency or excess. In general terms it reflects the amount of blood buffers. An abnormally high value is characteristic of alkalosis, a low value is characteristic of acidosis. Normal value – ± 2.3
HCO3- – plasma bicarbonate. The main renal component of the regulation of CBS. The normal value is 24 mEq/L. A decrease in bicarbonate is a sign of acidosis, an increase is a sign of alkalosis.
| Indicators | Arterial blood | Deoxygenated blood |
| pH | 7,35 – 7,45 | 7,33 – 7,43 |
| PaCO2 (mmHg) | 35 – 45 | 41 – 51 |
| PaO2 (mmHg) | 80 – 95 | 35 – 49 |
| SpO2 (%) | 95 – 99 | 70 – 75 |
| BE | ±2 | ±2 |
| HCO3- (meq/l) | 22 – 26 | 24 – 28 |