Electrocardiogram (ECG): interpretation of results
By: Administrator |
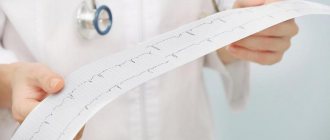
Tags: decoding ECG results, decoding ECG, ECG, ECG normal, Electrocardiogram, electrocardiogram decoding results | Comments: | June 24, 2021 Electrocardiography is a simple and informative study that determines heart rate indicators. A cardiograph records heart activity and records its parameters on paper. To evaluate them and draw conclusions about the patient’s condition, it is necessary to decipher the cardiogram. ECG interpretation is performed manually by comparing the characteristics of the graph with special tables or using computer programs to interpret the ECG results.
When and who needs to undergo heart diagnostics?
The doctor prescribes this diagnostic test in the following cases:
- high blood pressure;
- chest pain, shortness of breath;
- dizziness or fainting;
- heart murmurs;
- heart rhythm is disturbed;
- rheumatism;
- diabetes.
An electrocardiogram is also prescribed in case of overdose of certain medications. An ECG is part of the examination during medical examination, prof. examination, pregnancy, preparation for operations.
This is not an exhaustive list of cases when an ECG is necessary. In addition, it is performed without a doctor’s referral.
Invention of electrocardiography
In 1906, the famous Dutch scientist Willem Einthoven first recorded a clear electrical signal from the heart from the surface of the human body using a device he designed.
Photograph of an assembled electrocardiograph, demonstrating a method in which electrodes placed on the patient's arms and one leg are jars filled with a solution of table salt. Photo taken from the link:
Back in 1893, V. Einthoven proposed calling this signal an electrocardiogram (abbreviated ECG), and the device - an electrocardiograph. Later, he also developed a system for applying electrodes to the patient’s limbs (ECG lead system), introduced designations for the main fragments of the electrocardiographic signal (complex) and showed the correspondence of ECG fragments to various heart diseases.
From this moment on, the active introduction of electrocardiography in medicine began as a diagnostic method for the state of the cardiovascular system. In 1911, at the suggestion of V. Einthoven, the English company CSIC developed a desktop model of the device. In the forties of the last century, it became clear that for a detailed study of the ECG, the lead system according to V. Einthoven was not enough. In 1942, American cardiologist E. Goldberger obtained three more leads from the same electrodes placed on the limbs, which were called Goldberger enhanced. In 1946, the American cardiologist F. Wilson proposed ECG chest leads. This is how the modern system of 12 generally accepted leads was formed, which is widely used today.
Pathologies during ECG
The ECG is normal if all indicators are within a certain range. Otherwise, they speak of a deviation from the norm, but the presence of pathology must be determined by a doctor. Heart cardiogram decoding makes it possible to identify the following pathologies:
- Sinus arrhythmia suggests a physiological disorder, but is normal in children and adolescents.
- Atrial fibrillation can occur periodically or constantly, and is accompanied by a feeling in the patient of heart fluttering, anxiety, and panic.
- Sinus bradycardia, when the heart rate is about 50 beats per minute, is observed in healthy people during sleep and in athletes.
- Sinus tachycardia manifests itself in excess of the standard heart rate (90 beats per minute). In healthy people, it is temporarily observed during physical and emotional stress, drinking strong coffee, alcohol, and energy drinks. The pathology is indicated by a rapid heartbeat at rest.
- Extrasystole is characterized by a chaotic heartbeat, too frequent or too rare. Patients feel tremors behind the breastbone, tingling, empty stomach or sudden fear.
- Paroxysmal tachycardia manifests itself with periodic rapid heartbeat, while the pulse can reach 200-250 beats per minute. The duration of the attack can be from several minutes to several days.
- WPW syndrome is accompanied by a lack of air, a feeling of cardiac arrest for a moment, and a strong heartbeat.
Financial conditions
All lessons in the section “Textbook - simulator”, “Examples of cardiograms” are available freely. Exercises for the first 15 lessons in the “Textbook - Simulator” are also available freely (only authorization is required).
Starting from section 16 (“sinus tachycardia”), exercises are available for a fee. The cost of access to all sections is 10 rubles per day (for 24 hours). You can choose any number of days of access to paid sections. To transfer money, go to the "Payment" section.
Independent interpretation of ECG: algorithm of actions
Cardiogram analysis algorithms summarize practical experience and data taken from specialized literature. It is especially important to show how ECG interpretation is performed for students, interns, and paramedics who are starting their careers.
Sequence of actions when independently analyzing ECG results:
- Evaluate the rhythm and its regularity.
- The intensity of contractions of the heart muscle.
- The electrical axis of the heart or the frontal projection of the excitation vector of the ventricles and the direction of the electric wave along the ventricles during contraction are determined. The electrical axis of the heart is normal from 30° to 70°, direction down to right.
- The parameters of the P wave are determined.
- The QRS complex is analyzed.
- Determine the parameters of the ST segment.
- The characteristics of the T wave are analyzed.
- The characteristics of the remaining intervals and segments are analyzed.
Algorithms for ECG analysis in outpatient practice
Electrocardiography (ECG), despite more than 100 years of history of use in clinical practice, still remains a popular method for diagnosing cardiovascular pathology. At the beginning of the 20th century, Vladimir Filippovich Zelenin first began to conduct systematic electrocardiographic studies of patients in the clinic [1]. The method is of particular importance in outpatient general medical practice due to its information content and accessibility. The presence of portable devices allows for repeated use, including at home.
It is important that every doctor using this method can quickly and correctly interpret the data obtained. Today, a doctor has a large amount of available literature on clinical electrocardiography, which, as a rule, is addressed to functional diagnostic doctors [2–6].
The ECG analysis algorithms we have developed summarize and make data from specialized literature more accessible to primary care physicians. The practical application of these algorithms in practice, over many years of teaching experience to general practitioners, indicates the rationality and effectiveness of the presented methods for analyzing electrocardiograms for mastering the basics of electrocardiography and their use in clinical practice [7].
The main purpose of using these algorithms is to facilitate the development of techniques for interpreting electrocardiograms using simplified, but at the same time, academic methods of ECG analysis. The proposed algorithms make it possible to quickly answer the first important question facing an outpatient doctor: “norm - pathology”, and then, based on the clinical principle of diagnosis “symptom - syndrome - nosology”, which is close and understandable to a practicing physician, formulate an electrocardiographic conclusion.
The electrocardiogram reveals signs of deviation from the norm (ECG symptoms), grouped by one mechanism of development into ECG syndromes, and when compared with the age, gender, constitution of the patient, and clinical picture of the disease, an electrocardiographic conclusion (ECG diagnosis) is formulated.
The basis of the clinical diagnosis is the features of the clinical picture of the disease (onset, risk factors, clinical symptoms and syndromes, rate of progression), and electrocardiography plays an important but auxiliary role.
For an internist who does not have special knowledge of functional diagnostics, a strict procedure for ECG analysis is necessary. The use of the algorithm requires a strict sequence of analysis of the main elements of the electrocardiogram, which should include the following parameters:
- reference millivolt evaluation (standard millivolt = 10 mm);
- assessment of ECG registration speed (50 mm/sec or 25 mm/sec);
- determination of the main rhythm (sinus, ectopic);
- determining the correctness of the rhythm (equality of RR intervals; maximum and minimum RR distances differ from each other by less than 0.15 sec);
- counting heart rate (HR = 60: RR (sec) or using a ruler);
- characteristics of teeth, intervals, segments (table);
- determination of voltage (sufficient - if in at least one standard or unipolar lead the amplitude of the QRS complex is > 5 mm and in at least one of the chest leads > 8 mm);
- determination of the electrical axis of the heart;
- electrocardiographic report;
- comparison of ECG data with: the age and constitution of the patient;
- physiological characteristics (pregnancy, etc.);
- clinical picture and duration of the disease;
- ongoing therapy.
For each element of the ECG, it is necessary to analyze certain parameters, compare them with the norm, highlight deviations from the norm and make a conclusion.
In table The parameters that require analysis and their normal characteristics are listed, which makes it possible to identify the main deviations from the norm.
Rice. 1–3 directly reflect ECG diagnostic algorithms based on the “syndrome - nosology” principle. Following the algorithm requires the doctor to consistently and thoroughly analyze the ECG and most likely excludes the possibility of missing a significant pathology.
ECG examples
Thus, the proposed analysis of the parameters of ECG elements according to a specific plan, being the first step, gives direction to deciphering the electrocardiogram using literature sources on clinical medicine and functional diagnostics.
Literature
- Zelenin V.F. Electrocardiogram, its significance for physiology, general pathology, pharmacology and clinics // Military Med. zhurn., 1910. T. 228. P. 677.
- Orlov V.N. Guide to electrocardiography. M.: Medicine, 1983. 528 p., ill.
- Syrkin A. L. ECG for a general practitioner. M.: OJSC “Publishing House “Medicine”, 2006. 176 p., ill.
- Ebert G. Simple ECG analysis: interpretation, differential diagnosis. M.: “Logosphere”, 2010. 279 p.
- Proceedings of the 13th Congress “Clinical Electrocardiography”, April 25–26, 2012, Kaliningrad.
- Zimmerman F. Clinical electrocardiography. Second edition. 2016. 424 p. ISBN 978–5-9518–0164–7, 0–07–14302–8
- Chegaeva T.V. Algorithms for ECG diagnostics in general medical practice / Edited by Academician of the Russian Academy of Sciences I.N. Denisov. Moscow, 2011.
T. V. Chegaeva, Candidate of Medical Sciences E. O. Samokhina, Candidate of Medical Sciences T. E. Morozova1, Doctor of Medical Sciences, Professor
Federal State Autonomous Educational Institution of Higher Education First Moscow State Medical University named after. I. M. Sechenova Ministry of Health of the Russian Federation, Moscow
1 Contact information
Algorithms for ECG analysis in outpatient practice / T. V. Chegaeva, E. O. Samokhina, T. E. Morozova
For citation: Attending physician No. 2/2018; Page numbers in the issue: 20-23 Tags: heart, electrocardiographic report, diagnosis
How to make an appointment with a cardiologist
- It is advisable to undergo an ECG with interpretation and get advice from a qualified doctor by visiting a diagnostic and treatment center. Regular customers note the following benefits of service:
- Modern diagnostic equipment, which makes it possible to obtain an accurate diagnosis and speed up the examination.
- Patients are advised and accompanied by specialists with scientific degrees, doctors of the highest category with many years of practice.
- Carrying out an ECG in the clinic or at home, issuing the result immediately after the study.
- Completion of the study on the day of treatment or any convenient time.
To make an appointment with a cardiologist, just use the feedback button on the Loritom clinic website.
How the study of electrocardiography is structured on the site
In the “Textbook - simulator” section, educational topics on electrocardiography are posted in the form of lessons. At the end of each lesson there is a transition to exercises on this topic.
Familiarize yourself with the lesson content and get a general idea of the topic. Don't try to remember all the details right away. It will be more convenient to do this when further performing step-by-step exercises for the lesson.
Exercises are the main part of the teaching methodology on this site.
Perform consistently all the tasks that are offered after each lesson and in the control and repetition sections. This way you will be able to master the necessary knowledge and practical skills in electrocardiography in detail and without intense memorization.
Try it and decide if it's right for you.
The results of the exercises are saved in the database. This allows the site's computer program to evaluate your level on each academic topic. You can see the results of these assessments on the personal statistics page. Depending on how you perform the suggested training tasks, the statistics change accordingly.
Based on this data, the program determines which exercises to offer you and what additional information and explanations to provide you in a timely manner. This feedback tailors the learning to you.
The same exercise may be offered to you more than once during your work. Please complete all the tasks (and there should be many) patiently, as this will help you retain the information well and develop practical skills.
When starting the exercises, you need to log in (log in with your username and password) so that you can save information about the tasks you have completed in the database.
In addition to the “Textbook - simulator” section, read and regularly review the ECG in the “Examples of cardiograms” section.
For use in lesson texts, exercises and in the “Examples of cardiograms” section, the website has collected more than 1000 electrocardiograms from various sources. After each illustration there is a link to the source from which the example was taken.
Heart functions and their disorders
As has been shown, from a technical point of view, the heart is a complex biological electromechanical device that contains: a self-oscillator (SA node), information transmission lines (nerve fibers), excitatory mechanisms (nerve endings) and an actuator (muscle tissue or the blood pump itself ). Consequently, the performance of the heart is characterized by the following functions:
- automaticity;
- conductivity;
- contractility.
Automaticity determines the possibility of self-generation of heart contractions without the influence of external factors.
Conductivity is the ability to conduct excitation impulses from the SA node to muscle tissue.
Contractility characterizes the ability of the muscle tissue of the heart to perform work when receiving an excitation impulse.
There is one more function that does not follow from the considered electromechanical model of the heart. This is a function of excitability. Excitability is defined as the ability (sensitivity) of the heart to perform the systolic cycle under the influence of external impulses. With constant excitability, conditions could arise for superposition of systolic cycles (current from the influence of the SA node impulse and a random external one). To eliminate such collisions, a mechanism is provided in the heart to reduce the excitability threshold at the time of the developed systolic cycle until the predicted beginning of the next one. By the time of the expected next impulse of the SA node, the excitability threshold is restored.
All known heart diseases cause disturbances in one or more of the four functions discussed. Violations of these functions (with the exception of contractility) cause ECG changes. Therefore, ECG diagnostics makes it possible to identify heart diseases that are not related to a violation of contractility function only. Taking into account the fact that most diseases that impair contractility affect the state of other functions, electrocardiography is an effective diagnostic tool for the state of the cardiovascular system.
Diagnosis of heart diseases using ECG
In the 50s of the last century, the medical community widely adopted the system of recording an ECG in 12 generally accepted leads. Electrocardiographs began to be produced en masse, allowing the recording of such ECGs. Electrocardiography has become a standard method for studying the cardiovascular system. Currently, there are a huge number of articles, monographs, and atlases that describe the manifestations of certain cardiac dysfunctions on the ECG. Deciphering or interpreting an ECG, or identifying cardiac dysfunction based on ECG changes, is the opposite task. This is a very complex process, since there can be several violations, each of them makes its own changes with possible overlaps that make correct interpretation difficult.
Any change in the ECG is a symptom of one or another dysfunction of the heart. As a result of interpretation, based on the identified symptoms, syndromes of certain disorders or pathologies are formed. Additional research is needed to make a diagnosis. Therefore, deciphering the ECG is called syndromic diagnosis, which is carried out by an electrocardiologist. The final diagnosis is established by a cardiologist based on the deciphered ECG and other studies prescribed by him.
It is clear that no interpretation of the ECG would be possible without its quantitative description. For the first time, the designations of the main ECG fragments in the systolic phase, which are still used today, were proposed by V. Einthoven.
Designations of the main elements of the ECG. Figure taken from the link: https://commons.wikimedia.org/wiki/File:Qrs.png?uselang=ru/ (This file is licensed under a Creative Commons Attribution-Share Alike 3.0 Unported license)
The figure shows three waves (P, T, U) and three teeth (Q, R, S). The ECG pattern in one systolic cycle is called PQRST or cardio or atrioventricular complex. Quantitative parameters that describe the ECG are the amplitudes and durations of waves and waves, intervals between waves and waves, polarities and shapes of P and T waves. There are 19 parameters in total. All fragments are not always present on the ECG, so the number of parameters may be smaller. In addition, an important ECG parameter for assessing the function of automaticity or heart rhythm is the intervals between adjacent diastolic cycles - RR intervals.
Below is an ECG recorded in 12 conventional leads. In the columns from left to right there are leads according to W. Einthoven (I, II, III), E. Goldberger (aVR, aVL, aVF) and F. Wilson (V1, ... V6), respectively.
ECG recorded in 12 conventional leads.
The total number of parameters describing the ECG, as shown below, can reach 154.
Displays the values of quantitative parameters describing the ECG.
When interpreting an ECG, a cardiologist measures the parameters of cardiac complexes and RR intervals and then, using the decision rules that he has been trained in, describes the identified syndromes (if any). Thus, the doctor’s conclusion on the ECG is based on the assessment of the heart rhythm and the shape of the atrioventricular complex.
Electrocardiography, due to its advantages (non-invasiveness, relatively inexpensive and small-sized equipment, does not require any special conditions for recording and interpretation, high diagnostic efficiency) is widely used as a primary study of the state of the cardiovascular system. Due to the fact that the 12-lead ECG is taken with the patient in the supine position, this type of study is called a resting ECG. The prevalence of this study is confirmed by the fact that in St. Petersburg in 2010, 2,700,000 resting ECGs were recorded and interpreted.
Resting ECG is used:
- in clinics when visiting patients with suspected cardiovascular diseases;
- in medical and physical education clinics to resolve issues of admission and the possibility of continuing sports;
- during preventive examinations of various population groups in order to identify disturbances in the functioning of the cardiovascular system in the early stages;
- when providing ambulance and emergency care;
- upon admission and during treatment in hospitals.
Errors when deciphering an ECG at rest
Despite the high diagnostic efficiency, erroneous conclusions are possible when studying an ECG at rest. Errors can be of two types:
- omission of a syndrome corresponding to real disorders (error of the first type) – underdiagnosis;
- detection of a syndrome of a non-existent disorder (error of the second type) – overdiagnosis.
Underdiagnostic errors are the most dangerous in terms of consequences associated with unprescribed treatment of an existing disease. Overdiagnosis errors are not dangerous, but because of them, additional tests are unnecessarily performed and the time of both the patient and doctors is wasted.
There are two factors causing erroneous conclusions. First of all, cardiovascular diseases do not always manifest themselves on an ECG. For various physiological reasons, the resulting myocardial infarction, for example, in 5 cases out of 100 does not cause the expected changes in the parameters of the cardiac complex. There are known cases of masking ECG forms of some disorders by others - more pronounced ones. As a result of the extensive accumulated experience in the use of electrocardiography, the probability of errors in the detection of various groups of cardiovascular disorders caused by the limitations of the method of studying the ECG at rest has been established.
Electrocardiologists also make mistakes when interpreting ECGs. The lower the qualifications of the specialist, the more often medical errors may occur.
General principle of diagnostics in medicine
Diagnosis of diseases in medicine is carried out according to the principle: from symptom to syndrome, from syndrome to diagnosis. Suppose we are in a forest in cloudy weather, and we need to determine the direction to the South. We look at the pines and see where their crowns are concentrated. The direction of crown concentration is a symptom of the direction to the South. However, to the south there may be a higher forest, shading the one where we are. Therefore, the crowns may thicken in a different direction, for example to the South-West. A symptom is one of the signs of an object (in our case, the direction to the South). It displays the object ambiguously due to not all known factors. Next we see an anthill. Its location relative to the tree is another evidence of the direction to the South. This is another symptom. For various reasons, the anthill may also not be exactly in the South. The sun came out from behind the clouds. Using it, knowing the time of day, you can approximately determine the desired direction. Another symptom. By comparing all three symptoms, you can more accurately determine the path to the South. This is already a syndrome. However, in order to go exactly in the right direction, a compass is required. The direction of its arrow is the diagnosis. A compass is a tool for determining direction. If it is not there, then the path is paved approximately as a result of the syndrome identified by several symptoms.
In medicine, symptoms are first identified - these are the patient’s complaints, for example, chest pain on the left. This symptom is a sign of various diseases. To find the cause of the patient's complaint, it is necessary to establish other symptoms. For example, does the patient have shortness of breath when climbing stairs? The presence of shortness of breath directs the doctor to the syndrome - disorders of the cardiovascular system. In other words, a number of symptoms (left chest pain and shortness of breath) suggest a syndrome (disorders of the cardiovascular system).
The path to diagnosis requires additional instrumental studies, the results of which can both refute and clarify the alleged syndrome until a final description of the cause of the patient’s complaint is made - a diagnosis that reveals pathological changes in the organ under study.
How to install electrodes on limbs?
For better memorization, you can use the traffic light rule. Place red on the right hand, yellow on the left hand, green on the left leg and black on the right leg. It is the last electrode that is grounding.
All placement is performed on the proximal part of the limbs. But, be sure to lubricate the place where the terminals are applied with gel. If there is no gel, you can take an isotonic solution or a gauze pad. If one of the limbs is missing, you need to install clamps on the stump. For better contact, you need to secure the terminals with rubber bands.
correct application of electrodes
