- ECG principle
- ECG registration in 3 standard leads
- Registration of ECG in 12 leads
- What does an ECG show?
- Normal ECG
- Pathologies in ECG
- Arrhythmia
- Atrial hypertrophy
- Blockade
- Ischemic disease
- Pericarditis
- Myocarditis
- Thromboembolism
- Hypokalemia
- Tachycardia
- Myocardial infarction
- How is ECG diagnosed?
- ECG methods
- ECG interpretation
- When to do an ECG
- Cost of ECG in our clinic
Electrocardiography is a method of recording and studying the electric fields that appear during the heart's work. These electrical fields give an accurate picture of how the cardiovascular system functions. ECG is an inexpensive and effective diagnostic method in cardiology.
ECG principle
The operation of the ECG device is that sensors placed on the patient’s body record the vector and strength of the electrical charge that the heart creates during operation. Changes in the electric charge vector are recorded on paper tape in the form of a graph. Analysis of this graph allows us to draw a conclusion about the correct functioning of the heart and possible diseases.
Electrocardiogram registration is carried out in:
- three standard leads;
- in 12 leads.
ECG registration in 3 standard leads
Registration of an electrocardiogram in 3 standard leads is called a single-channel ECG. It allows you to get a general picture of the condition of the heart and is used during a cardiac examination of the patient in the absence of specific complaints.
The potential difference is determined between:
- left hand and right hand - this is an indicator of the work of the anterior wall of the heart;
- between the left leg and right arm - this is the total reflection of leads 1 and 3;
- between the left leg and left arm - this is an indicator of the work of the posterior wall of the heart.
These leads form an equilateral Einthoven triangle, the vertices of which are located on the electrodes placed on the limbs. In the middle of the triangle is the electrical center of the heart. The electrode on the right is not used for leads, but is intended for grounding.
The line connecting two electrodes of the same lead is called the lead axis. When the vector of the electrical charge of the heart is in the negative part of the lead axis, then a negative deviation is recorded - Q, S waves; if the vector is in the positive part of the lead axis, then a positive deviation is recorded - P, R, T waves.
Registration of ECG in 12 leads
Registration of a 12-lead electrocardiogram is used for specific patient complaints to obtain additional information about the functioning of the cardiovascular system, minor changes, identify the focus of ischemia or necrosis, and the causes of conduction and rhythm disturbances.
In addition to the 3 standard leads, the potential difference is determined between:
- between the left leg and joint hands (aVF) - this is an indicator of the work of the posterior-inferior heart wall;
- between the left arm and the combined left leg and right arm (aVL) - this is an indicator of the work of the left anterolateral wall;
- between the right arm and the combined left leg and left arm (aVR) is a measure of right lateral wall function.
In addition, six unipolar chest leads are used, when 6 electrodes are installed directly on the chest:
- V1 and V2 are an indicator of the work of the right ventricle;
- VЗ is an indicator of the functioning of the interventricular septum;
- V4 is an indicator of the performance of the apex;
- V5 is an indicator of the work of the left ventricle and the anterolateral wall;
- V6 is an indicator of the work of the lateral wall of the left ventricle.
Registration of data from unipolar chest leads allows one to judge the position of the heart in the chest, the size of the ventricles, determine hypertrophy of the right sections, assess the condition of the atria and identify various pathologies.
Registration of an ECG in 12 leads allows you to determine even small changes in the work of the heart that ECG registration in 3 standard leads will not show.
What is the electrical position of the heart?
Electroposition is close in value to EOS. In this case, a horizon line is drawn - axis I of the first standard lead, and the resulting vector, QRS, will indicate the electrical position of the heart.
- The position is vertical. In this case, the QRS is located vertically relative to the axis.
- The position is horizontal. The resulting vector is visible on the cardiogram, which is located horizontally relative to the axis
Sometimes an intermediate electrical position occurs when the resulting vector is partially located semi-vertically and partially semi-horizontally. This is the basic electrical cardiac position.
What does an ECG show?
Electrocardiography shows:
- heart rate;
- heart rate;
- position of the electrical axis of the heart;
- size and location of the heart;
- heart condition.
If pathologies are present, electrocardiography can reveal:
- arrhythmia;
- blockade;
- myocardial infarction;
- ischemic changes;
- dystrophic processes;
- electrolyte disturbances;
- Wolff–Parkinson–White syndrome;
- ventricular hypertrophy;
- other pathological processes in the heart.
Limits of deviation of the electrical axis of the heart
To determine the heart axis in the frontal plane, an analysis of 2 or more limb leads is required, for which vector analysis is performed. In this case, ventricular depolarization is represented as an average depolarization vector with an arrow pointing in a certain direction.
The length of the vector represents the magnitude of the potential created by the difference in charges between the activated (or depolarized) cardiac cells and the resting cardiac cells, while the direction of the arrow represents the average direction of the depolarization vectors.
Ventricular depolarization spreads from the negatively charged area to the positively charged area.
Normal ECG
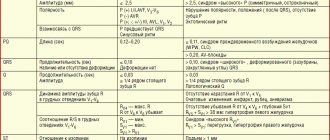
A normal electrocardiogram consistently displays:
- zero line;
- small P wave - normally lasting 0.7 - 0.12 seconds and amplitude 0.5 - 2.5 mm;
- small flat segment PQ;
- negative Q wave (may be absent) - normally lasting 0.03 seconds and amplitude 0.3 - 0.5 mm;
- a high positive R wave, normally with an amplitude of 10-19 mm, and a negative S wave, with a normal amplitude of 0.2-0.5 mm;
- flat ST segment;
- rounded positive T wave - normally lasting 0.12-0.28 seconds and with an amplitude of no more than a quarter of the R wave;
- very low rounded positive U wave.
The norm of intervals is:
- PQ - duration 0.2 - 0.8 seconds;
- PR - duration 0.18 - 0.2 seconds;
- QRST - duration 0.38 - 0.55 seconds;
- QRS - duration 0.06 - 0.1 seconds;
- ST - duration 0.35 - 0.44 seconds.
Heart rate
calculated as:
Heart rate = 60/(distance between teeth R * K). K is a coefficient depending on the speed at which the electrocardiogram is taken: at a speed of 25 mm/s the coefficient is 0.04, and at 50 mm/s the coefficient is 0.08.
The norm is 50-90 beats per minute.
For example, if the distance R was 20 mm, and the cardiogram was taken at a speed of 25 mm/s:
Heart rate = 60/(20*0.04) = 75 beats per minute (normal).
Heartbeat
assessed by the degree of rhythm of the cardiogram. Normally, it should be repeatable with possible deviations of up to 10%. To evaluate deviations, the distance between the RR teeth is compared.
In this case, the heart rhythm normally has a sinus nature, as indicated by the P wave, which is positive in leads 1 and 2 and negative in lead aVR.
Basically, such indicators indicate that the heart is healthy. But it is worth remembering that the ECG decoding must be done by a doctor; only he can make the correct diagnosis, so you should not decipher the electrocardiogram yourself.
Mobitz I
This type of blockade of the second type can be physiological for young people and athletes. On the ECG it appears as an increase in the PQ interval with each contraction. The interval increases until the atrial impulse is blocked (this is shown on the cardiogram as the absence of the QRS complex).
Also, as with the first type of blockade, patients may not suspect the presence of disturbances in the conduction system of the heart and may not experience any clinically manifested symptoms.
If a second-degree block of Mobitz type I is detected, a re-examination should be carried out , including 24-hour heart rate monitoring and a repeat electrocardiogram. Treatment is prescribed after identifying the cause of the blockade.
Pathologies in ECG
An electrocardiogram different from normal may indicate various diseases and disorders of the heart.
Diseases may include:
- arrhythmia;
- atrial hypertrophy;
- blockade;
- ischemic disease;
- pericarditis;
- myocarditis;
- thromboembolism;
- hypokalemia;
- tachycardia;
- heart rhythm disturbances;
- myocardial infarction.
Arrhythmia
Arrhythmia is characterized by the fact that among the normal contractions of the heart there are also contractions with deviations from the norm, the heart beats less often or more often than necessary, the size of the cardiogram teeth is not the same in each heartbeat.
Such ECG features may indicate arrhythmia.
Arrhythmia can be dangerous and lead to thromboembolism, heart failure and even cardiac arrest in the absence of timely treatment and assistance.
Atrial hypertrophy
With left atrial hypertrophy on the ECG, the P wave in leads 1 and 2 is double-humped, and in V1 it is negative and long.
Atrial myocardial hypertrophy is an increase in the thickness of the myocardial wall of the heart, in conditions of chronic overload of the heart with volume and pressure. Hypertrophy can lead to cardiac arrhythmia.
Blockade
With bundle branch block, the ECG shows a widening of the QRS interval, and with complete blockade, the ST segment and T wave become negative.
Blockade is a slowdown in the conduction of an electrical signal through the conduction system of the heart. Causes heart rate to slow to less than 50 beats per minute.
Ischemic disease
With coronary heart disease on the ECG, the ST segment is slightly lowered, and the T wave has a shallow negative value.
Coronary artery disease is stenosis of the coronary arteries resulting from atherosclerosis. As a result of arterial blockage, myocardial infarction may develop.
Pericarditis
With pericarditis, the ECG shows a slight rise in the ST segment from the ascending knee of the S wave, concave downward, and the T wave is positive. In chronic pericarditis, the ST segment is not elevated, and the T wave is negative and sharp.
Pericarditis is an inflammatory lesion of the serous membrane of the heart, manifested in the appearance of fluid in the area of the pericardium and fibrosis, which leads to difficulty in the functioning of the heart.
With timely diagnosis and treatment, the patient makes a full recovery.
Myocarditis
With myocarditis, the ECG often shows depression of the ST segment and a negative T wave. But not always, there are other ECG features that indicate myocarditis, such as a change in the duration of the PQ interval, signs indicating blockade of the left or right leg of the PG and heart rhythm disturbances .
Myocarditis is damage to the muscular lining of the heart as a result of inflammatory processes. Leads to heart failure, shortness of breath, cardiac arrhythmias, discomfort, pain in the heart area and other symptoms.
If myocarditis is detected, hospitalization and treatment are required.
Thromboembolism
With thromboembolism of the pulmonary arteries on the ECG, the RS-T segment is shifted upward and a negative T wave is observed in leads V1-V4.
Thromboembolism is a blockage of a vessel by a blood clot and disruption of blood flow.
If thromboembolism is detected, urgent hospitalization and treatment are necessary.
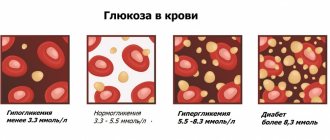
Hypokalemia
With hypokalemia, the ECG shows a large U wave in the initial form of the disease, and in severe forms, ST segment depression and a deep negative T wave.
Hypokalemia is a reduced concentration of potassium ions in the blood. May cause fatigue, weakness, breathing problems, intestinal obstruction and other disorders.
Treatment is aimed at replenishing potassium levels in the body.
Tachycardia
Tachycardia is characterized by an increase in heart rate above 90 beats per minute at rest. With tachycardia, an increased QRS segment may be observed on the ECG.
Tachycardia is a symptom that indicates the presence of a number of diseases, most often the endocrine and nervous systems.
When tachycardia is detected, further diagnostics are required to identify the cause and eliminate it.
Myocardial infarction
With myocardial infarction, the ECG in one case may show both the absence of ST segment elevation and the Q wave, as well as ST segment elevation and deformation, a large Q wave and a pointed negative T wave.
Myocardial infarction is an acute, life-threatening disease that requires rapid hospitalization and surgical treatment.
Myocardial infarction occurs due to thrombosis of the coronary artery, resulting in blockage of the artery, partial or complete cessation of blood supply and the beginning of the process of tissue death.
Introduction to the basic elements of a cardiogram
You should know that the interpretation of the ECG is carried out thanks to elementary, logical rules that can be understood even by the average person. For a more pleasant and calm perception of them, it is recommended to start familiarizing yourself first with the simplest principles of decoding, gradually moving to a more complex level of knowledge.
Tape marking
The paper on which data on the functioning of the heart muscle is reflected is a wide ribbon of a soft pink shade with a clear “square” marking. Larger quadrangles are formed from 25 small cells, and each of them, in turn, is equal to 1 mm. If a large cell is filled with only 16 dots, for convenience you can draw parallel lines along them and follow similar instructions.
The horizontal lines of the cells indicate the duration of the heartbeat (seconds), and the vertical lines indicate the voltage of individual ECG segments (mV). 1 mm is 1 second of time (in width) and 1 mV of voltage (in height)! This axiom must be kept in mind throughout the entire period of data analysis; later its importance will become obvious to everyone.
The paper used allows you to accurately analyze periods of time
Teeth and segments
Before moving on to the names of specific departments of the dentate graph, it is worth familiarizing yourself with the activity of the heart itself. The muscular organ consists of 4 compartments: the 2 upper ones are called atria, the 2 lower ones are called ventricles. Between the ventricle and the atrium in each half of the heart there is a valve - a valve responsible for accompanying the flow of blood in one direction: from top to bottom.
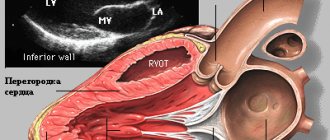
Signs of right ventricular hypertrophy on the ECG
This activity is achieved thanks to electrical impulses that move through the heart according to a “biological schedule”. They are directed to specific segments of the hollow organ using a system of bundles and nodes, which are miniature muscle fibers.
The birth of the impulse occurs in the upper part of the right ventricle - the sinus node. Next, the signal passes to the left ventricle and excitation of the upper parts of the heart is observed, which is recorded by the P wave on the ECG: it looks like a flat inverted bowl.
After the electrical charge reaches the atrioventricular node (or AV node), located almost at the junction of all 4 pockets of the heart muscle, a small “point” appears on the cardiogram, directed downwards - this is the Q wave. Just below the AV node there is the following point the destination of the impulse is the His bundle, which is fixed by the highest R wave among others, which can be imagined as a peak or mountain.
Having overcome half the path, an important signal rushes to the lower part of the heart, through the so-called branches of the His bundle, which externally resemble long octopus tentacles that hug the ventricles. The conduction of the impulse along the branching processes of the bundle is reflected in the S wave - a shallow groove at the right foot of R. When the impulse spreads to the ventricles along the branches of the His bundle, their contraction occurs. The last hummocky T wave marks the recovery (rest) of the heart before the next cycle.
Not only cardiologists, but also other specialists can decipher diagnostic indicators
In front of the 5 main waves on the ECG you can see a rectangular protrusion; you should not be afraid of it, since it represents a calibration or control signal. Between the teeth there are horizontally directed sections - segments, for example, ST (from S to T) or PQ (from P to Q). To independently make an approximate diagnosis, you will need to remember such a concept as the QRS complex - the union of the Q, R and S waves, which records the work of the ventricles.
The teeth that rise above the isometric line are called positive, and those located below them are called negative. Therefore, all 5 teeth alternate one after another: P (positive), Q (negative), R (positive), S (negative) and T (positive).
Leads
You can often hear the question from people: why are all the graphs on the ECG different from each other? The answer is relatively simple. Each of the curved lines on the tape reflects heart parameters obtained from 10-12 colored electrodes, which are installed on the limbs and in the chest area. They read data on the cardiac impulse, located at different distances from the muscle pump, which is why the graphs on the thermal tape are often different from each other.
Only an experienced specialist can competently write an ECG report, but the patient has the opportunity to review general information about his health.
How is ECG diagnosed?
The electrocardiography procedure is painless and quick:
- A patient enters the ECG diagnostic room.
- He takes off his clothes to the waist and rolls up his pants, exposing the shins of his legs.
- The doctor lubricates the sensors with gel and attaches them to the patient’s body, fixing them.
- The doctor asks the patient to take the desired body position on the couch, standing or on a bicycle ergometer.
- The diagnostician turns on the ECG machine and begins recording a diagram.
- The doctor removes the sensors from the patient’s body, asks to wipe the body with gel wipes and gets dressed.
- The doctor analyzes the electrocardiogram, makes a diagnosis, gives recommendations and further instructions.
With 24-hour Holter monitoring, the doctor places sensors on the patient's body that are connected to a small portable device that collects electrocardiographic data continuously throughout the day. The sensors and ECG device are hidden under clothing and the patient wears them for 24 hours. Then he returns to the doctor, removes the device and sensors. The doctor analyzes the ECG, draws conclusions and makes a diagnosis for the patient.
ECG methods
- Classic method
. Registration of an electrocardiogram in 3 standard and 12 leads. The electrodes are attached to the body of the patient, who lies on the couch. The cardiogram is taken at rest. - Vectorcardiography
. The electrical vector of the heart's work is recorded and displayed as a projection of a three-dimensional figure on the lead plane. - Load tests
. Registration of an ECG when the patient is on a bicycle ergometer with increasing stepwise physical activity. Most often used to diagnose coronary heart disease. - Holter monitoring
. Record electrocardiography continuously throughout the day using a special portable device. - Precordial mapping
. Electrodes with a 6x6 matrix are fixed on the patient’s chest, the signals from which are processed by a computer. Used to determine myocardial damage in acute myocardial infarction. - Intraesophageal electrocardiography
. The ECG is recorded using an electrode inserted into the patient's esophagus. Used to diagnose blockades and determine the condition of the atria and atrioventricular connection. - Gastrocardiomonitoring
. Simultaneous recording of gastrogram and electrocardiogram during the day. Used to diagnose gastro- and cardiac diseases. - High resolution electrocardiography
. Registration of low-amplitude and high-frequency potentials, with an amplitude of the order of 1-10 µV and using multi-bit ADCs (16-24 bits).
ECG interpretation
The doctor deciphers the electrocardiogram; only he can identify diseases, make the correct diagnosis and give further directions. A person without medical education should not deal with ECG interpretation.
When deciphering an electrocardiogram, the diagnostician pays attention to the duration, amplitude, shape, frequency, repeatability and other parameters of the following elements of the cardiogram:
- P wave;
- PQ segment;
- Q wave;
- R wave;
- S wave;
- ST segment;
- T wave
What is the normal EOS?
The mean axis can be determined in the interval by first looking at the amplitude of the R wave and then at the combined amplitudes of the Q wave, R waves, and S waves. The resulting vector, called the QRS axis, approximates the mean EOS.
The QRS axis is the “mean” direction of electrical activity during ventricular depolarization. The QRS axis may shift due to a physical change in the position of the heart, chamber hypertrophy, or conduction block.
The normal QRS axis is -30 to +90 degrees. A value more negative than -30 is called left axis deviation. A value more positive than +90° is called axis deviation to the right.
The QRS axis can shift during the respiratory cycle if the rise of the diaphragm changes the physical position of the heart. Changes in the QRS axis (changes in QRS shape) are called “electrical alternans.” It is thought to be caused by physical vibrations of the heart in the pericardial effusion.
Normal for children and adults
The principles of ECG interpretation in children are identical to those in adults, but the progressive changes in anatomy and physiology that occur between birth and adolescence result in some features that differ significantly from the normal adult pattern and vary with the age of the child.
Therefore, correct interpretation of ECG is potentially difficult, and detailed knowledge of these age-related changes is critical.
| Age | Normal QRS Axis Values | Abnormal values | Description |
| For adults | 30 — 90° | <30° | EOS deviation to the left |
| From 30 to - 45° | Moderate axis deviation to the left | ||
| From – 45 to 90° | Marked deviation of the EOS to the right | ||
| From 90 to 120° | Moderate deviation to the right | ||
| From 90 to 180° | Marked deviation of the EOS to the right | ||
| From 8 to 16 years | 0 — 120° | >120° | Deviation to the right |
| From 5 to 8 years | 0 — 140° | >140° | Deviation to the right |
| < 0° | Deviation to the left | ||
| From 1 year to 5 years | 5 — 100° | >100° | Deviation to the right |
| From 1 month to 1 year | 10 — 120° | >120° | Deviation to the right |
| From <10 to - 90° | Deviation to the left | ||
| Newborns | 30 — 90° | > 190 to — 90° | Extreme deviation to the right |
| < 30 to <- 90° | Deviation to the left |
Standards of normal values to aid in the interpretation of ECGs in children have been known for many years. Rhythm changes observed in apparently normal children during random 24-hour observation periods have been well described, but the longer-term consequences of these changes have not been systematically examined.
Reasons for EOS deviation to the left
Leftward axis movement occurs when additional electrical forces move to the left (hypertrophy) or when the time required for electrical activity to move through the ventricle increases.
Some causes of EOS shift to the left include hypertension, aortic stenosis or regurgitation, hypertrophic subaortic stenosis, mitral valve regurgitation, and impaired left ventricular conduction.
When to do an ECG
Electrocardiography should be done in the following cases:
- Referrals from a general practitioner or other physician;
- For preventive purposes, once a year after 40 years;
- Pain in the chest or under the shoulder blade;
- Labored breathing;
- Swelling of the limbs and face;
- Shortness of breath at rest;
- High blood pressure;
- Chronic diseases of the musculoskeletal system.
Cost of ECG in our clinic
We provide the following services in the field of cardiology and ECG diagnostics:
- Primary appointment with a cardiologist - 1500 rubles;
- Repeated appointment with a cardiologist - 1400 rubles;
- ECG with interpretation - 500 rubles;
- ECG without interpretation - 250 rubles;
- Interpretation of an ECG done in another clinic - 300 rubles;
- Daily Holter ECG monitoring - 2200 rubles;
- Comprehensive daily monitoring of blood pressure + ECG according to Holter - 3500 rubles;
- Bicycle ergometry (stress tests) - 1800 rubles;
- “Healthy Heart” program - 6,500 rubles;
- Daily blood pressure monitoring - 1700 rubles;
- Tropanin test - 400 rubles.
You can make an appointment for an ECG with a doctor through the online form on the website or by phone 8
and
+7 (4872) 49-57-57
.
All articles "
On the eve of the study
Patients who are prescribed an ECG must begin preparing for the examination the day before diagnosis with the following activities:
- Complete peace of mind . On the eve of the ECG, it is necessary to completely protect yourself from stressful situations if possible. Experiences and high anxiety can distort the results of a cardiogram.
- Full sleep . Before the study, be sure to get enough sleep. In a tired body, the heart functions in an enhanced mode.
- Quitting alcohol . It is strictly forbidden to drink alcohol before an ECG. Alcohol causes the blood to thicken, causing the heart to work much harder.
- Proper nutrition . You should not overload the body with too heavy dinner and breakfast before the ECG. It is advisable to exclude fatty and heavy foods from the diet. Otherwise, the body will devote all its reserves to digesting food, and the heart will be forced to work “for wear and tear.”
- Refusal of physical activity . In order for the cardiogram to show reliable results, doctors advise not to exercise on the eve of the ECG, and to do without exercise or jogging in the morning.
- Elimination of thermal procedures . It is not recommended to visit saunas or steam baths before taking an ECG. Doctors advise against taking a bath. Any thermal procedures can increase blood circulation and heart activity.
- Taking medications . The day before the examination, it is necessary to completely avoid taking medications, except those that are prescribed on a regular basis. The doctor must know about the latter.