Electrocardiography (ECG) is one of the simplest, fastest and safest diagnostic procedures used to assess the condition of a baby’s heart, be it a newborn or an older child. An ECG measures and records changes in the electrical activity of the heart that characterize its performance. ECG data shows doctors the speed and regularity of the heart's contractions, the size and position of the heart's chambers, the amount of blood flowing into the heart muscle, and whether there are any abnormalities in its normal functioning. With the help of electrocardiography, it is possible not only to identify acute or chronic diseases that have already developed, but also to predict their occurrence, which means to begin treatment on time and prevent them.
Physical foundations of electrocardiographic research.
An electrocardiograph is a galvanometer device for recording the difference in electrical potentials between two areas of the heart’s projection onto the surface of the child’s body. During operation, the electrical activity of the heart constantly and rhythmically changes. For each stage of contraction or relaxation of the heart muscle of each section, there is its own unique “electrical” pattern, which is recorded by an electrocardiograph and issued in the form of a characteristic graph - a cardiogram on a strip of paper or a computer screen. The shape and parameters of the characteristic elements of the cardiogram (main intervals, amplitudes, shapes and sizes of teeth) carry information for the doctor about the normal or pathological physiology of the heart. The number of waves per minute on the graph shows the heart rate, the distances between identical elements of the cardiogram - heart rate. ECG waveforms show how the heart's electrical impulses are formed and how well the individual parts of the heart work together. Characteristic changes in the shape of the size and position of the waves on the cardiogram carry information about any damage to the heart.
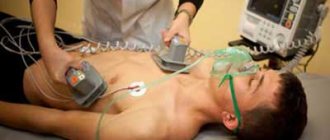
Electrical activity from the surface of the body is recorded through small metal plates (electrodes) that are placed in specific places on the child's chest, arms and legs. The electrodes are connected to the cardiograph by wires through which information is recorded. The electrocardiograph records the electrical activity of the heart, all parameters that are measured, analyzed and printed for the doctor.
What does an electrocardiogram show?
The result of electrocardiography is a graph drawn on thermal paper, which is called an electrocardiogram and consists of teeth, segments and intervals, based on the height and location of which the cardiologist receives the following data about the state of the child’s cardiac activity: sinus rhythm of the heart, heart rate, impulse conductivity and others characteristics.
Evaluating these data, the pediatric cardiologist identifies:
- abnormal heart rate (the norm for children under 3 years old is up to 110 beats per minute, up to 5 years old - 100, up to 8 years old - 90-100, up to 12 years old - 70-85);
- heart rhythm disturbances - extrasystole;
- violation of sinus rhythm - arrhythmia;
- decreased normal heart rate - bradycardia;
- excess heart rate - tachycardia;
- impaired conduction of the heart muscle - depression of cardiac function, heart block;
- increase in myocardial mass - hypertrophy of the heart;
- inflammation of the heart muscle - myocarditis;
- acute disruption of the blood supply to the heart muscle - myocardial infarction;
- violation of the anatomy of parts of the heart muscle - congenital or acquired heart disease, etc.
What diseases can be detected using electrocardiography in children?
Screening (preventive) electrocardiography of the heart, carried out in infants aged 4-5 days and 3-4 weeks of life, allows timely identification of electrocardiographic signs (arrhythmias, prolongation of the ventricular contraction phase), indicating the possible development of sudden death syndrome (one of the leading causes of infant mortality in the first year of life), and start preventive treatment on time.
- An ECG can detect hypertrophy of the baby's heart, which can be caused by congenital heart defects, abnormal heart valves, high blood pressure, insufficient cardiac contractility, or conduction problems.
- Electrocardiography can detect abnormalities in the electrical conductivity of the heart tissue, which can cause a child's heart to beat too fast, too slow, or at an uneven speed (arrhythmias), causing discrepancies in the rhythm of the atria and ventricles.
- An electrocardiogram will show how well the heart muscle is supplied with blood, and whether there are any disturbances in the blood supply to individual areas, both at rest and during physical activity.
- An ECG can be used to judge the functioning of the heart valves and disturbances in blood flow due to their dysfunction.
- Based on the ECG results, we can conclude that there is an imbalance in the level of electrolyte substances in the child’s blood that are necessary for the proper functioning of the heart muscle, such as potassium, magnesium and calcium.
- Electrocardiography can reveal signs of inflammatory heart diseases (endocarditis, myocarditis, pericarditis).
- Based on the results of the ECG, one can judge the presence of cardiomyopathy - an abnormality in the heart muscle itself.
What is an ECG?
An electrocardiogram (ECG) is a proven, simple and informative method for studying the heart muscle. Electrical potentials resulting from the work of the heart are recorded using special sensors attached to the body. The pulses, amplified 600–700 times, enter a device called an electrocardiograph, which deciphers the information received and displays it in the form of graphs on a moving paper tape. An ECG is absolutely painless, does not take much time and, due to its safety, can be used in both adults and children for the diagnosis and prevention of many dangerous cardiovascular diseases.
What can you find out with an ECG?
First of all, an electrocardiogram allows you to evaluate the frequency and regularity of heart contractions. In addition, using an ECG, you can identify metabolic disorders - deficiency of calcium, magnesium, potassium and other electrolytes. An ECG of a child’s heart helps detect serious diseases such as:
- congenital heart defects, acquired heart defects, myocarditis;
- myocardial infarction;
- hypertrophy (abnormal enlargement) of various parts of the heart;
- angina pectoris;
- disturbances of heart rhythm and intracardiac conduction (heart block);
- pulmonary embolism;
- metabolic disorders in the myocardium against the background of various diseases and pathological conditions.
Benefits of ECG
This method has many compelling advantages. He:
- easy to carry out (does not require special training and subsequent rehabilitation);
- affordable;
- allows multiple repetitions without harm to health and allows doctors to track the development of a small patient’s heart over time, which is especially important for a child in the first years of life.
All this has made ECG a procedure indispensable for the work of both adult and pediatric cardiologists.
Preparing a child for an ECG
Preparing your child for an electrocardiogram does not require restrictions on food and drink: your child can eat and drink as usual. It is recommended to feed the baby a few minutes before the test to calm him down. For an older child, you can take his favorite toy with you for research.
Your baby's skin should be clean: You should not apply any cream, lotion, powder or baby oil to your baby's skin on the day of the test.
The child's clothing should allow electrodes to be attached to the child's chest, wrists and ankles. Infants will need to be swaddled as directed by the nurse to ensure they remain still during the examination.
Installation of electrodes
Both reusable and disposable electrodes can be used to take an ECG. The first option is used more often in medical institutions, because is more economical. Kit includes:
- electrodes for limbs: 4 pieces;
- electrodes placed on the chest (one or 6);
- pears with suction cups.
Each electrode must be connected to a cable that matches its color. The designations must be memorized, because Most often there is confusion with them.
- A red cable is connected to the electrode on the right hand.
- On the left is yellow.
- The green wire is connected to the electrode on the left leg.
- On the right there will be a black, grounding cable that does not take readings.
How is an ECG performed?
The total time of the electrocardiographic examination takes from 5 to 10 minutes, including attaching and detaching electrodes. During the examination, your child will lie on a special changing table or couch. Several electrodes (small plastic patches with metal strips) will be attached to your baby's chest, and one electrode will be attached to each arm and leg. The electrodes will be connected to the electrocardiograph by wires. During the ECG recording, the child will not feel anything unpleasant. Electrodes are just highly sensitive sensors that respond to changes in the electrical impulses of the heart. Under no circumstances will any current pass or pass through the child’s body.
It is important that your child lies still during the examination and does not speak during the procedure; for infants, it is important that the baby is calm and does not cry. You, as a parent, can be present to support and reassure your child during the procedure.
Once the recording of the study from the sensors is complete, the doctor or nurse will disconnect the wires and remove the electrodes from the skin. After the procedure, the child can lead his normal lifestyle without any restrictions. The research results will be analyzed by the electrocardiograph computer, and then by the doctor who performed the diagnosis, your pediatrician or pediatric cardiologist.
Due to its characteristics (in the 1st year of a child’s life, there are 12 different periods of age norms for ECG), the electrocardiogram of infants must be analyzed by the doctor who conducted the study.
When is an ECG of a child’s heart necessary?
According to statistics, today every second resident of large cities consults a cardiologist. Cardiovascular disease remains a dismal leader in the list of the most common health problems. Therefore, in civilized countries, the practice of mandatory electrocardiographic examination of a baby in the first year of life has been introduced. In addition, an ECG is always performed for the child:
- before entering preschool and school educational institutions;
- during medical examination;
- before visiting the sports section;
- before planned operations;
- regularly with hereditary predisposition and chronic ENT diseases (for example, tonsillitis);
- after acute purulent tonsillitis, bronchitis, pneumonia;
- when detecting a heart murmur.
| This is important to know ! If your baby gets tired quickly when sucking or his lips and skin around his mouth turn blue, call a pediatric cardiologist. If a child loses consciousness, swells, gets tired quickly, complains of dizziness, pain in the heart and joints, call a pediatric cardiologist. If your baby is bothered by frequent sore throats, call a pediatric cardiologist. |
Special types of electrocardiography
In some cases, as prescribed by a pediatrician or pediatric cardiologist, special electrocardiographic studies may be prescribed for older children.
Bicycle erogmetry (stress test): when a cardiogram is taken during dosed physical activity (rotating the pedals of an exercise bike). This study allows you to see how a child’s heart reacts to physical activity.
Holter monitoring : For an in-depth study of arrhythmias, a long-term ECG recording of 15-20 minutes may be required. To identify hidden disturbances in the blood supply to the heart and the rhythm of its work over a long period of time, ECG Holter monitoring is used. In this case, electrodes are attached to the child's skin, and a small computer-cardiograph is hung on the child's neck or belt, which constantly records the ECG.
Standard electrocardiography in pediatric practice
Electrocardiography (ECG) remains one of the most common methods for examining the cardiovascular system and continues to develop and improve. Based on the standard electrocardiogram, various modifications of the ECG have been proposed and are widely used: Holter monitoring, high-resolution ECG, tests with dosed physical activity, drug tests [2, 5].
Leads in electrocardiography
The concept of “electrocardiogram lead” means recording an ECG when electrodes are applied to certain areas of the body that have different potentials. In practical work, in most cases, registration of 12 leads is limited: 6 from the limbs (3 standard and 3 “unipolar reinforced”) and 6 thoracic leads - unipolar. The classic lead method proposed by Einthoven is the registration of standard limb leads, designated by Roman numerals I, II, III [6].
Enhanced limb leads were proposed by Goldberg in 1942. They record the potential difference between one of the limbs on which the active positive electrode of a given lead is installed (right arm, left arm or left leg), and the average potential of the other two limbs. These leads are designated as follows: aVR, aVL, aVF. The designations for augmented limb leads come from the first letters of English words: a - augmented (reinforced), V - voltage (potential), R - right (right), L - left (left), F - foot (leg).
Unipolar chest leads are designated by the Latin letter V (potential, voltage) with the addition of the position number of the active positive electrode, indicated in Arabic numerals:
lead V1 is an active electrode located in the fourth intercostal space along the right edge of the sternum;
V2 - in the fourth intercostal space along the left edge of the sternum;
V3 - between V2 and V4;
V4 - in the fifth intercostal space along the left midclavicular line;
V5 - in the fifth intercostal space along the anterior axillary line;
V6 - in the fifth intercostal space in the midaxillary line.
Using the chest leads, you can judge the condition (size) of the heart chambers. If the usual program for recording 12 generally accepted leads does not allow one to reliably diagnose a particular electrocardiographic pathology or requires clarification of some quantitative parameters, additional leads are used. These could be leads
V7 - V9, right chest leads - V3R-V6R [6].
Electrocardiogram recording technique
The ECG is recorded in a special room, remote from possible sources of electrical interference. The study is carried out after a 15-minute rest on an empty stomach or no earlier than 2 hours after a meal. The patient should be undressed to the waist, the lower legs should be freed from clothing. Electrode paste must be used to ensure good skin contact with the electrodes. Poor contact or the appearance of muscle tremors in a cool room can distort the electrocardiogram. The examination, as a rule, is carried out in a horizontal position, although nowadays examinations have also begun to be carried out in a vertical position, since in this case a change in autonomic support leads to a change in some electrocardiographic parameters [7].
It is necessary to record at least 6-10 cardiac cycles, and in the presence of arrhythmia, much more - on a long tape.
Normal electrocardiogram
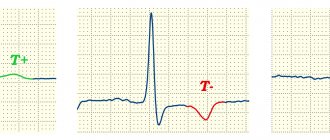
On a normal ECG, 6 waves are distinguished, designated by the letters of the Latin alphabet: P, Q, R, S, T, U. The electrocardiogram curve (Fig. 1) reflects the following processes: atrial systole (P wave), artioventricular conduction (PR interval or, as it was previously designated as the P-Q interval), ventricular systole (QRST complex) and diastole - the interval from the end of the T wave to the beginning of the P wave. All waves and intervals are characterized morphologically: the teeth - by height (amplitude), and the intervals - by time duration, expressed in milliseconds. All intervals are frequency-dependent quantities. The relationship between heart rate and the duration of one or another interval is given in the corresponding tables. All elements of a standard electrocardiogram have a clinical interpretation.
| Figure 1. Normal electrocardiogram |
Electrocardiogram analysis
The analysis of any ECG should begin with checking the correctness of its recording technique: to exclude the presence of various interferences that distort the ECG curve (muscle tremors, poor contact of electrodes with the skin), it is necessary to check the amplitude of the control millivolt (it should correspond to 10 mm). The distance between the vertical lines is 1 mm, which corresponds to 0.02 s when the belt moves at a speed of 50 mm/s, and 0.04 s at a speed of 25 mm/s. In pediatric practice, a speed of 50 mm/s is preferable, since against the background of physiological age-related tachycardia, errors are possible when calculating intervals at a tape speed of 25 mm/s.
In addition, it is advisable to take an ECG with a change in the patient’s position: in the wedge- and orthoposition, since in this case a change in the nature of autonomic support can contribute to a change in some parameters of the electrocardiogram - a change in the characteristics of the pacemaker, a change in the nature of the rhythm disturbance, a change in heart rate, a change in characteristics conductivity [2].
The general scheme of ECG analysis includes several components.
- Analysis of heart rate and conductivity: - determination of the source of excitation; - counting the number of heartbeats; — assessment of the regularity of heart contractions; — assessment of the conductivity function.
- Determination of rotations of the heart around the anteroposterior, longitudinal transverse axes: - the position of the electrical axis of the heart in the frontal plane (rotations around the anteroposterior, sagittal axis); — rotations of the heart around the longitudinal axis; - rotation of the heart around the transverse axis.
- Analysis of the atrial P wave.
- Analysis of the ventricular QRST complex: - analysis of the QRS complex; — analysis of the RS-T segment; - T wave analysis; - QT interval analysis.
- Electrocardiographic report.
Heart rate and conduction analysis
The source of excitation is determined by determining the polarity of the P wave and its position relative to the QRS complex. Sinus rhythm is characterized by the presence in standard lead II of positive P waves preceding each QRS complex. In the absence of these signs, a non-sinus rhythm is diagnosed: atrial, rhythm from the AV junction, ventricular rhythms (idioventricular), atrial fibrillation.
Counting the number of heartbeats is carried out using various methods. The most modern and simplest method is counting using a special ruler. If this is not available, you can use the following formula:
Heart rate = 60 RR,
where 60 is the number of seconds in a minute, RR is the duration of the interval, expressed in seconds.
If the rhythm is incorrect, you can limit yourself to determining the minimum and maximum heart rate, indicating this spread in the “Conclusion”.
Heart rate regularity is assessed by comparing the duration of RR intervals between successively recorded cardiac cycles. The RR interval is usually measured between the tips of the R (or S) waves. The spread of the obtained values should not exceed 10% of the average duration of the RR interval. It has been shown that sinus arrhythmia of varying severity is observed in 94% of children. Conventionally, V degrees of sinus arrhythmia severity are distinguished:
I degree - there is no sinus arrhythmia or fluctuations in heart rate per 1 minute do not exceed 5 contractions;
II degree - mild sinus arrhythmia, rhythm fluctuations within 6-10 contractions per minute;
III degree - moderately severe sinus arrhythmia, rhythm fluctuations within 11-20 contractions per 1 minute;
IV degree - pronounced sinus arrhythmia, rhythm fluctuations within 21-29 contractions per 1 minute;
V degree - pronounced sinus arrhythmia, rhythm fluctuations within 30 or more contractions per minute. Sinus arrhythmia is a phenomenon inherent in healthy children of all ages [7].
In addition to physiologically observed sinus arrhythmia, abnormal (irregular) heart rhythm can be observed with various types of arrhythmias: extrasystole, atrial fibrillation and others.
Assessment of conduction function requires measurement of the duration of the P wave, which characterizes the speed of conduction of the electrical impulse through the atria, the duration of the PQ (PR) interval (conduction speed through the atria, AV node and His system) and the total duration of the ventricular QRS complex (conduction of excitation through the ventricles). An increase in the duration of intervals and waves indicates a slowdown in conduction in the corresponding part of the conduction system of the heart.
The PQ interval (PR) corresponds to the time it takes for an impulse to travel from the sinus node to the ventricles and varies depending on age, gender and heart rate. It is measured from the beginning of the P wave to the beginning of the Q wave, and in the absence of a Q wave, to the beginning of the R wave. Normal fluctuations in the PR interval are between 0.11-0.18 s. In newborns, the PR interval is 0.08 s, in infants - 0.08-0.16 s, in older ones - 0.10-0.18 s. Slowing of atrioventricular conduction may be due to vagal influence [1, 2].
The PR interval may be shortened (less than 0.10 s) as a result of accelerated impulse conduction, innervation disorders, due to the presence of an additional fast conduction path between the atria and ventricles. Figure 3 shows one of the options for shortening the PR interval.
This electrocardiogram (see Fig. 2) reveals signs of the Wolff-Parkinson-White phenomenon, including: shortening of the PR interval to less than 0.10 s, the appearance of a delta wave on the ascending limb of the QRS complex, deviation of the electrical axis of the heart to the left. In addition, secondary ST-T changes may be observed. The clinical significance of the presented phenomenon lies in the possibility of the formation of supraventricular paroxysmal tachycardia by the re-entry mechanism (re-entry of the impulse), since additional conduction pathways have a shortened refractory period and are restored to conduct the impulse faster than the main pathway [8].
| Figure 2. ECG of child V. G., 14 years old. Diagnosis: Wolff-Parkinson-White phenomenon |
Determination of the position of the electrical axis of the heart
Rotations of the heart around the anteroposterior axis. It is customary to distinguish three conventional axes of the heart, as an organ located in three-dimensional space (in the chest).
The sagittal axis is anteroposterior, perpendicular to the frontal plane, passing from front to back through the center of mass of the heart. Turning counterclockwise along this axis brings the heart to a horizontal position (displacement of the electrical axis of the QRS complex to the left). Rotate clockwise to a vertical position (displacement of the QRS electrical axis to the right).
The longitudinal axis anatomically runs from the apex of the heart to the right venous opening. When rotated clockwise along this axis (viewed from the apex of the heart), most of the anterior surface of the heart is occupied by the right ventricle; when rotated counterclockwise, the left ventricle is occupied.
The transverse axis passes through the middle of the base of the ventricles perpendicular to the longitudinal axis. When rotating around this axis, a displacement of the heart is observed with the apex forward or the apex backward.
The main direction of the electromotive force of the heart is the electrical axis of the heart (EOS). Rotations of the heart around the conventional anteroposterior (sagittal) axis are accompanied by deviation of the EOS and a significant change in the configuration of the QRS complex in standard and enhanced unipolar limb leads.
Rotations of the heart around the transverse or longitudinal axes are referred to as so-called positional changes.
The determination of EOS is carried out using tables. To do this, compare the algebraic sum of the R and S waves in standard leads I and III.
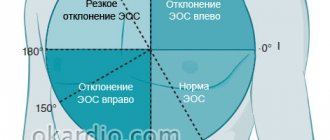
There are the following options for the position of the electrical axis of the heart:
- normal position when the alpha angle is from +30° to +69°;
- vertical position - alpha angle from +70° to +90°;
- horizontal position - alpha angle from 0° to +29°;
- axis deviation to the right - alpha angle from +91° to +180°;
- axis deviation to the left - alpha angle from 0° to - 90°.
The nature of the location of the heart in the chest, and, accordingly, the main direction of its electrical axis, is largely determined by the characteristics of the physique. In children with asthenic physique, the heart is located vertically. In children with a hypersthenic constitution, as well as with a high position of the diaphragm (flatulence, ascites), it is horizontal, with a deviation of the apex to the left. More significant turns of the EOS around the anteroposterior axis, both to the right (more than +90°) and to the left (less than 0°), are usually caused by pathological changes in the heart muscle. A classic example of deviation of the electrical axis to the right is the situation with a ventricular septal defect or tetralogy of Fallot. An example of hemodynamic changes leading to deviation of the electrical axis of the heart to the left is aortic valve insufficiency.
An easier way to roughly determine the direction of the EOS is to find the limb lead in which the R wave is the highest (without an S wave or with a minimal S wave). If the maximum R wave in lead I is a horizontal position of the EOS, if in lead II it is normal, if in lead aVF it is vertical. Registration of the maximum R wave in lead aVL indicates a deviation of the EOS to the left, in lead III - a deviation of the EOS to the right, but if the maximum R wave is in lead aVR, the position of the EOS cannot be determined.
Atrial P wave analysis
P wave analysis includes: change in P wave amplitude; measurement of P wave duration; determination of P wave polarity; determination of the shape of the P wave.
The amplitude of the P wave is measured from the isoline to the top of the wave, and its duration is measured from the beginning to the end of the wave. Normally, the amplitude of the P wave does not exceed 2.5 mm, and its duration is 0.10 s.
Since the sinus node is located in the upper part of the right atrium between the mouths of the superior and inferior vena cava, the ascending part of the sinus node reflects the state of excitation of the right atrium, and the descending part reflects the state of excitation of the left atrium, and it is shown that the excitation of the right atrium occurs before the left by 0. 02-0.03 s. The normal P wave is rounded in shape, gently sloping, with symmetrical rise and fall (see Fig. 1). The cessation of atrial excitation (atrial repolarization) is not reflected on the electrocardiogram, as it merges with the QRS complex. In sinus rhythm, the direction of the P wave is positive.
In normosthenics, the P wave is positive in all leads except lead aVR, where all electrocardiogram waves are negative. The largest value of the P wave is in standard lead II. In individuals of asthenic physique, the size of the P wave increases in standard III and aVF leads, while in lead aVL the P wave may even become negative.
With a more horizontal position of the heart in the chest, for example in hypersthenics, the P wave increases in leads I and aVL and decreases in leads III and aVF, and in standard lead III the P wave may become negative.
Thus, in a healthy person, the P wave in leads I, II, aVF is always positive, in leads III, aVL it can be positive, biphasic or (rarely) negative, and in lead aVR it is always negative.
Ventricular QRST analysis
The QRST complex corresponds to the electrical systole of the ventricles and is calculated from the beginning of the Q wave to the end of the T wave.
Components of the electrical systole of the ventricles: the QRS complex itself, the ST segment, the T wave.
The width of the initial ventricular QRS complex characterizes the duration of excitation transmission through the ventricular myocardium. In children, the duration of the QRS complex ranges from 0.04 to 0.09 s, in infants - no wider than 0.07 s.
The Q wave is the negative wave before the first positive wave in the QRS complex. The Q wave can be positive only in one situation: congenital dextracardia, when it is facing upward in standard lead I. The Q wave is caused by the spread of excitation from the AV junction to the interventricular septum and papillary muscles. This most variable ECG wave may be absent in all standard leads. The Q wave must meet the following requirements: in leads I, aVL, V5, V6, not exceed 4 mm in depth, or 1/4 of its R, and also not exceed 0.03 s in duration. If the Q wave does not meet these requirements, it is necessary to exclude conditions caused by a deficiency of coronary blood flow [2]. In particular, in children, anomalous origin of the left coronary artery from the pulmonary artery (ALCA from PA or Bluntd-White-Garland syndrome) often appears as a congenital pathology of the coronary vessels [2,3]. With this pathology, the “coronary” Q wave is most often persistently detected in lead aVL (Fig. 3).
| Figure 3. ECG of child R. B., 4 years old. Diagnosis: anomalous origin of the left coronary artery from the pulmonary artery |
The presented electrocardiogram (see Fig. 3) reveals a deviation of the electrical axis of the heart to the left. In lead aVL, the Q wave is 9 mm, with a height of R = 15 mm, the duration of the Q wave is 0.04 s. At the same time, in standard lead I, the duration of the Q wave is also 0.04 s, in the same lead there are pronounced changes in the final part of the ventricular complex in the form of depression of the ST interval. The suspected diagnosis of anomalous origin of the left coronary artery from the pulmonary artery was confirmed by echocardiography and then by coronary angiography.
At the same time, in infants, a deep Q wave may be in lead III, aVF, and in lead aVR the entire ventricular complex may have a QS appearance.
The R wave consists of ascending and descending knees, is always directed upward (except in cases of congenital dextracardia), reflects the biopotentials of the free walls of the left and right ventricles and the apex of the heart. The ratio of the R and S waves and the change in the R wave in the chest leads are of great diagnostic importance. In healthy children, in some cases, different sizes of the R wave are observed in the same lead - electrical alternans.
The S wave, like the Q wave, is an unstable negative ECG wave. It reflects a somewhat late coverage of excitation of distant, basal areas of the myocardium, supraventricular crests, conus arteriosus, and subepicardial layers of the myocardium.
The T wave reflects the process of rapid repolarization of the ventricular myocardium, i.e., the process of restoration of the myocardium or cessation of excitation of the ventricular myocardium. The state of the T wave, along with the characteristics of the RS-T segment, is a marker of metabolic processes in the ventricular myocardium. In a healthy child, the T wave is positive in all leads except aVR and V1. In this case, in leads V5, V6, the T wave should be 1/3-1/4 of its R.
The RS-T segment—the segment from the end of the QRS (the end of the R or S wave) to the beginning of the T wave—corresponds to the period of full coverage of the ventricles by excitation. Normally, an upward or downward displacement of the RS-T segment is permissible in leads V1-V3 of no more than 2 mm [4]. In the leads most distant from the heart (in standard and unipolar leads from the limbs), the RS-T segment should be on the isoline, with a possible upward or downward displacement of no more than 0.5 mm. In the left chest leads, the RS-T segment is recorded on the isoline. The transition point of the QRS to the RS-T segment is designated as the RS-T junction point j (junction).
The T wave is followed by a horizontal T-P interval, corresponding to the period when the heart is at rest (diastole).
The U wave appears 0.01-0.04 s after the T wave, has the same polarity and ranges from 5 to 50% of the height of the T wave. To date, the clinical significance of the U wave has not been clearly defined.
QT interval. The duration of ventricular electrical systole has important clinical significance, since a pathological increase in ventricular electrical systole may be one of the markers of the appearance of life-threatening arrhythmias.
Electrocardiographic signs of hypertrophy and overload of the heart cavities
Cardiac hypertrophy is a compensatory adaptive reaction of the myocardium, expressed in an increase in the mass of the heart muscle [6]. Hypertrophy develops in response to increased stress in the presence of acquired or congenital heart defects or with increased pressure in the pulmonary or systemic circulation.
Electrocardiographic changes in this case are caused by: an increase in the electrical activity of the hypertrophied part of the heart; slowing down the conduction of an electrical impulse through it; ischemic, dystrophic and sclerotic changes in the altered heart muscle.
However, it should be noted that the term “hypertrophy” widely used in the literature does not always strictly reflect the morphological essence of the changes. Often, dilatation of the heart chambers has the same electrocardiographic signs as hypertrophy, with morphological verification of the changes.
When analyzing the ECG, the transition zone (Fig. 4) in the precordial leads should be taken into account.
| Figure 4. Condition of the main electrocardiogram waves in the chest leads. Transition zone |
The transition zone is determined by the lead in which the R and S waves, i.e., their amplitude on both sides of the isoelectric line, are equal (see Fig. 4). In healthy older children, the QRS transition zone is usually determined in leads V3, V4. When the ratio of vector forces changes, the transition zone moves towards their predominance. For example, with right ventricular hypertrophy, the transition zone moves to the position of the left precordial leads and vice versa.
Signs of atrial overload
Electrocardiographic signs of left atrium overload form an electrocardiographic complex of signs, called P-mitrale in the literature. Enlargement of the left atrium is a consequence of mitral regurgitation with congenital, acquired (due to rheumatic carditis or infective endocarditis), relative mitral regurgitation or mitral stenosis. Signs of left atrium overload are presented in Figure 5.
Enlargement of the left atrium (see Fig. 5) is characterized by:
- an increase in the total duration (width) of the P wave by more than 0.10 s;
- widened double-humped P wave in leads I, aVL, V5-V6;
- the presence of a pronounced negative phase of the P wave in lead V1 (more than 0.04 s in duration and more than 1 mm in depth).
| Figure 5. ECG of child K.I., 12 years old. Diagnosis: rheumatism, age-related rheumatic carditis, mitral valve insufficiency |
Since the lengthening of the P wave can be caused not only by an enlargement of the left atrium, but also by intra-atrial block, the presence of a pronounced negative phase of the P wave in lead V1 is more important when assessing overload (hypertrophy) of the left atrium. At the same time, the severity of the negative phase of the P wave in lead V1 depends on the heart rate and on the general characteristics of the wave voltage.
Electrocardiographic signs of overload (hypertrophy) of the right atrium form a complex of signs called P-pulmonale, since it develops in pulmonary pathology, as well as in chronic pulmonary heart disease. However, these conditions are uncommon in children. Therefore, the main causes of enlargement of the right atrium are congenital heart defects, such as Ebstein's tricuspid valve anomaly, as well as primary changes in the pulmonary artery - primary pulmonary hypertension.
| Figure 6. ECG of child V.S., 13 years old. Primary pulmonary hypertension |
Signs of right atrium enlargement are presented in Figure 6.
- Enlargement of the right atrium (see Fig. 6) is characterized by:
- a high-amplitude P wave with a pointed apex in leads II, III, aVF, this sign is required in lead V1 or V2;
- with a P wave duration not exceeding 0.10 s.
In Figure 6, in addition to signs of right atrium overload, there are also signs of right ventricular overload.
Signs of ventricular overload (hypertrophy)
Since the ECG normally reflects the activity of only the left ventricle, electrocardiographic signs of left ventricular overload emphasize (exaggerate) the norm. Where the R wave is normally high (in lead V4, the position of which coincides with the left border of the heart), it becomes even higher; where the S wave is normally deep (in lead V2), it becomes even deeper.
Many voltage criteria for overload (hypertrophy) of the left ventricle have been proposed - more than 30. The most well-known include the Sokolov-Lyon index: the sum of the amplitudes of the R wave in lead V5 or V6 (where there is more) and S in lead V1 or V2 (where there is more ) more than 35 mm. However, the amplitude of the waves in the precordial leads is influenced by the gender, age and constitution of the patient. Thus, an increase in the voltage of the teeth can be observed in thin young people. Therefore, secondary changes in the final part of the ventricular complex are of great importance: displacement of the ST interval and T wave. As a sign of a relative deficiency of coronary blood flow, deepening of the Q wave in leads V5, V6 is possible. But at the same time, the Q wave should not exceed more than 1/4 of its R and 4 mm in depth, since this sign indicates a primary coronary pathology [2].
Predominant dilatation of the left ventricle has the following characteristics: R in V6 is greater than R in V5, greater than R in V4 and greater than 25 mm; sudden transition from deep S waves to high R waves in the precordial leads; shift of the transition zone to the left (towards V4) (Fig. 7).
| Figure 7. ECG of child G. Sh., 3 years old. Diagnosis: congenital mitral valve insufficiency |
Signs of predominant hypertrophy of the left ventricular myocardium are depression (displacement below the isoline) of the ST segment in lead V6, possibly also in V5 (Fig.  [4, 7].
| Figure 8. ECG of child G. Sh., 3 years old. Diagnosis: congenital mitral valve insufficiency |
Electrocardiographic signs of overload (hypertrophy) of the right ventricle appear when its mass increases by 2-3 times. The most reliable sign of right ventricular hypertrophy is the qR complex in lead V1.
Additional signs are secondary changes in the form of ST segment displacement and changes in the T wave. In some pathological conditions, in particular with an atrial septal defect, right ventricular hypertrophy is also demonstrated by incomplete right bundle branch block in the form of rsR in lead V1 (Fig. 9) [ 7].
| Figure 9. ECG of child M.K., 8 years old. Diagnosis: atrial septal defect |
In conclusion, a standard electrocardiogram is very important for an adequate diagnosis, subject to several rules. This is, firstly, taking an electrocardiogram with a change in body position, which makes it possible to initially differentiate organic and inorganic damage to the heart. Secondly, this is the choice of the optimal shooting speed - for children 50 mm/s. Finally, the electrocardiogram should be analyzed taking into account the individual characteristics of the child, including his constitution.
For questions regarding literature, please contact the editor.
The editors apologize for typos
In the output of the article “Foot and Mouth Disease”, No. 8 2004, you should read:
A. E. Kudryavtsev, Candidate of Medical Sciences, Associate Professor, T. E. Lisukova, Candidate of Medical Sciences, Associate Professor, G. K. Alikeeva, Candidate of Medical Sciences Central Research Institute of Epidemiology, Ministry of Health of the Russian Federation, Moscow
In the article by I. Yu. Fofanova “Some issues of the pathogenesis of intrauterine infections”, No. 10.2004. On page 33 in the 2nd column from left to right it should be read: “In the second trimester (after clarification of the diagnosis), the use of antibacterial therapy is indicated, taking into account the sensitivity of antibiotics (penicillin or macrolides). Prescription of amoxiclav, augmentin, ranklav, azitrox, sumamed during pregnancy is possible only when the expected benefit to the mother outweighs the potential risk to the fetus or child. Despite the fact that experimental studies have not revealed the teratogenic effects of these drugs, their use during pregnancy should be avoided.”
E. V. Murashko, Candidate of Medical Sciences, Associate Professor of Russian State Medical University, Moscow
Decoding the results
ECG results are available almost immediately. When performing electrocardiography on a traditional device with recording the results on paper or when analyzing the ECG of a baby under the age of 1 year, the doctor will need some time to decipher the results. When using a computer electrocardiograph, a conclusion with calculations of all the main parameters of the cardiogram is issued almost instantly. ECG recordings in this case are stored in the form of computer files that can be viewed and printed. In the case of analyzing the cardiogram of children under 1 year of age, if deviations from the norm are found in the cardiogram, the help of a cardiologist may be required to decipher and interpret the cardiogram.
In some cases, a repeat electrocardiographic study or a special type of ECG may be required, accompanied by other types of studies (ultrasound of the heart, Doppler sonography of blood vessels).
Fixation of electrodes on the limbs
On the legs, a pair of electrodes are fixed on the inside of the lower leg at the very bottom. It must be remembered that a grounding sensor is attached to the right leg. On the hands, electrodes are attached to the forearms.
With standard leads, indicators are taken as follows:
- left and right hands - first position;
- right arm and left leg - second position;
- left leg and arm - third position.
Thus, an Einthoven triangle is obtained, each side of which corresponds to one and possible leads.
Enhanced leads involve collecting a signal using one electrode, which records the potential difference between the area where it is applied and the conventional electrical zero. They have the following designations:
- right hand - aVR;
- left hand - aVL;
- left leg - aVF.
Electrocardiographic monitoring of the heart condition in a child
As your baby develops from fetus to newborn, infant to child, teenager to adult, the body's growth and development causes major permanent changes in the size and position of your baby's heart. The most dramatic of these changes occur at birth and during the first year of life. Unfortunately, not all children undergo such significant changes in the body without complications. Therefore, doctors recommend regular preventive electrocardiographic monitoring of your child’s heart function. Early detection of pathology or a predisposition to it will allow you to choose and carry out the required treatment with maximum effectiveness, or make sure that your child is healthy and his body is developing without deviations from the norm.
Remember that if any abnormalities are detected on the ECG, further examination of the child’s cardiovascular system is recommended. Also, all children with detected changes on the ECG are subject to dynamic monitoring by a pediatric cardiologist.
Electrocardiography is an informative, fast and safe method of studying the condition of a child’s heart, which allows you to accurately establish a diagnosis and carry out the required treatment with maximum efficiency, or get rid of worries and doubts about the state of your baby’s health.
To obtain additional information about electrocardiography for a child, you can sign up for diagnostics at a medical center by calling +7 (812) 331-24-22.
Essence and advantages of the method
The method of obtaining information for drawing an electrocardiogram graph is based on recording the electrical potentials that arise during the work of the heart muscle. Registration is carried out using sensors that are attached to certain points on the child’s body. Despite the emergence of new methods for studying the heart, ECG is used for preventive and diagnostic purposes at the first stage of examining the cardiovascular system of children, since it has the following advantages:
- efficiency in obtaining survey results;
- high information content;
- high accuracy of results;
- absolute safety for a child of any age - from several months to 18 years;
- the ability to take readings of heart function over time;
- the ability to diagnose a range of cardiac pathologies in one procedure;
- the ability to conduct diagnostics in a clinic or at home for a young patient;
- affordability
Get an ECG done for a child at the Paracelsus Clinic, Sergiev Posad
ATTENTION:
Online consultations with doctors (more than 18 specialties) are available.
Electrocardiography
of a child in pediatrics is a screening method that is used to analyze the functioning of the cardiovascular system. ECG for children is a highly informative type of research in pediatric cardiology, as the first stage of examination. The functioning of the cardiovascular system in children of different ages has many features. Therefore, it is important that the ECG results are interpreted by a competent pediatrician or cardiologist.
During the examination
To record an electrocardiogram, special electrodes are used, which can be attached to the body on the surface of the skin with “suction cups” or metal plates. According to the research program, a total of 12 leads are used. In this case, electrodes are placed on both arms and legs and six electrodes on the chest. The 12-lead electrocardiograms obtained on film are the result of this application of electrodes. Amplified electrical vibrations are recorded using a special recording system. Electrodes for children under 8 years of age are used in smaller sizes than for adults. For children 2-3 months old, the chest electrodes are oval-shaped so that sharp corners do not injure the baby’s delicate skin. It is preferable to use plates rather than suction cups, since suction cups often leave pinpoint hemorrhages and do not allow additional ECG examination in a standing position. Currently, to simplify the study, electrodes in the form of light clamps are applied to the limbs; children call them “crocodiles.” They are easy to remove and do not intimidate your baby with the difficulty of securing the strap around the ankle or wrist, as was the case with older models.
The electrocardiogram is recorded in a horizontal position of the child after 10-15 minutes of rest; the room should be warm so that muscle tremors do not distort the electrocardiogram. To ensure a tighter fit of the electrodes, the skin at the site where the electrodes are applied is lubricated with a special gel, creating an airless space. The gel is absolutely harmless, does not leave any marks on the child’s body or on his clothes, and can be easily removed with cotton wool, a cloth or a paper napkin.
ECG monitoring in children
Holter monitoring
ー method of recording an electrocardiogram for 24 hours. To do this, a set of electrodes is attached to the child’s chest, and a signal receiver from the electrodes is attached to the belt. During the day, the little patient should maintain his usual daily routine: sleep, eat, play, run, etc. Parents need to record his actions in detail, indicating the time, so that the doctor can compare changes in the electrocardiograph readings with what the child was doing at that time.
ECG in a newborn during the first two days of life
In the ECG of children, individual fluctuations are observed during the first two days. Immediately after birth, the heart rate is 157 per minute, and after cutting the umbilical cord - 142 per minute. In the first hours after birth, doctors note fluctuations in the RR interval from 0.44 to 0.54″, the heart rate is 123.0±1.8 per minute. To perform an ECG on an infant, it is important to swaddle him well. This is necessary to ensure that the recording of the electrocardiographic curve is correct. The child should be warm and motionless. Swaddling is abandoned only if the child is in serious condition and practically does not move. It is recommended to record an ECG 1.5-2 hours after feeding and before X-ray examinations and physical procedures.