From this article you will learn what EOS is and what it should be normally. When the EOS is deviated slightly to the left - what does this mean, what diseases can it indicate. What treatment may be required.
Author of the article: Victoria Stoyanova, category 2 doctor, head of the laboratory at the diagnostic and treatment center (2015–2016).
Article publication date: 05/14/2017
Article updated date: 02/05/2020
The electrical axis of the heart is a diagnostic criterion that reflects the electrical activity of the organ.
The electrical activity of the heart is recorded using an ECG. Sensors are placed on different areas of the chest, and to find out the direction of the electrical axis, it (the chest) can be represented as a three-dimensional coordinate system.
The direction of the electrical axis is calculated by the cardiologist during the interpretation of the ECG. To do this, he sums the values of the Q, R and S waves in lead 1, then finds the sum of the values of the Q, R and S waves in lead 3. Next, it takes the two obtained numbers and calculates the alpha angle using a special table. It's called the Diede table. This angle is the criterion by which it is determined whether the location of the electrical axis of the heart is normal.
EOS offsets
The presence of a significant deviation of the EOS to the left or right is a sign of cardiac dysfunction. Diseases that provoke EOS deviation almost always require treatment. After getting rid of the underlying disease, the EOS takes a more natural position, but sometimes it is impossible to completely cure the disease.
To resolve this problem, consult a cardiologist.
Projection of the EOS onto the limb leads
The position of the EOS is determined by a six-axis diagram, in which the axes are standard and enhanced limb leads (Diagram 2).
Scheme 2. Six-axis diagram for determining EOS in the frontal plane
The position of the EOS is determined in degrees in accordance with this diagram.
The diagram shows six limb leads: I, II, III, aVL, aVF, aVR. Standard lead I was taken as the reference point. Next to each lead it is indicated what deviation in degrees the EOS will correspond to if the electrical excitation wave is directed to this lead.
If the EOS is oriented towards lead I, then the angle of deviation of the EOS is zero. In such cases, we talk about the horizontal position of the EOS. If the EOS is oriented towards lead aVF, then the angle of deflection of the EOS is 900. In such cases, we speak of the vertical position of the EOS.
For diagnostic purposes, the following assessments of the position of the electrical axis of the heart are used:
- Normal EOS position: from -30o to 90o.
- EOS deviation to the left: from -30o to -90o.
- EOS deviation to the right: from 90o to 180o.
- Sharp (or extreme) deviation of EOS: from -90o to 180o.
In addition, within the normal position of the EOS, the terms horizontal position of the EOS (from 00 to 300) and vertical position of the EOS (from 700 to 900) are used.
With various pathological changes, the position of the EOS can change significantly and this explains the diagnostic value of this ECG parameter. There are several reasons for deviation of EOS in pathology:
- With left ventricular hypertrophy, overload of the left ventricle (for example, with arterial hypertension), and slower conduction of excitation through the left ventricle, electrical activity in the left half of the heart increases. This often leads to deviation of the EOS to the left.
- With right ventricular hypertrophy, overload of the right ventricle (for example, with pulmonary embolism), or slower conduction of excitation through the right ventricle, electrical activity in the right half of the heart increases. This often leads to deviation of the EOS to the right.
The significance of EOS deviations for various violations will be discussed in more detail in the relevant sections.
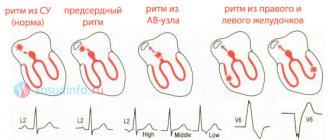
Conducting system of the heart and why is it important for determining EOS?
The conduction system of the heart consists of sections of the heart muscle consisting of so-called atypical muscle fibers. These fibers are well innervated and provide synchronous contraction of the organ.
Myocardial contraction begins with the appearance of an electrical impulse in the sinus node (which is why the correct rhythm of a healthy heart is called sinus). From the sinus node, the electrical impulse travels to the atrioventricular node and further along the His bundle. This bundle passes through the interventricular septum, where it divides into the right, heading towards the right ventricle, and the left legs. The left bundle branch is divided into two branches, anterior and posterior. The anterior branch is located in the anterior sections of the interventricular septum, in the anterolateral wall of the left ventricle. The posterior branch of the left bundle branch is located in the middle and lower third of the interventricular septum, the posterolateral and inferior wall of the left ventricle. We can say that the posterior branch is located slightly to the left of the anterior one.
The myocardial conduction system is a powerful source of electrical impulses, which means that electrical changes that precede cardiac contraction occur in it first of all in the heart. If there are disturbances in this system, the electrical axis of the heart can significantly change its position , which will be discussed below.
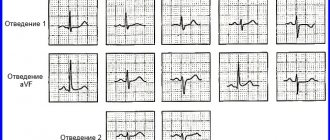
Assessing the position of the EOS using ECG
The position of the EOS on the cardiogram is determined by the QRS complexes, which are recorded in the limb leads: I, II, III, aVL, aVF, aVR. In order to evaluate the EOS, it is necessary to find among the listed leads those in which the algebraic sum of the teeth of the QRS complex, i.e. R - (Q+S), maximum, minimum and equal to zero (or close to zero).
The EOS is directed from the lead in which the sum of the QRS waves is the smallest (negative), towards the lead in which the sum of the QRS waves is the largest (positive), and perpendicular to the lead in which the sum of the QRS waves is zero.
See how this looks in ECG 1.
ECG 1. EOS deviation to the left. The angle is -300
On ECG 1 it is easy to determine that the maximum algebraic sum of QRS waves is recorded in lead aVL. In aVL, the tooth R = 17 mm, Q = 2 mm, the tooth S is absent, so the sum of the teeth is 15 mm (since 17 mm - 2 mm = 15 mm).
Similarly, we determine that the minimum algebraic sum of QRS waves will be in lead III: R = 3 mm, S = 19 mm, there is no Q wave, so the sum of the teeth is -16 mm (since 3 mm - 19 mm = -16 mm) .
The algebraic sum of the waves R - (Q + S) is equal to or close to zero in lead II.
Therefore, in this example, the electrical axis of the heart is directed from lead III towards lead aVL and perpendicular to lead II. This means that the deviation angle is -300, and in such cases they speak of EOS deviation to the left.
The table in Scheme 3 lists possible combinations of R-(Q+S) values for different EOS positions.
Scheme 3. Table for determining the position of the EOS
Let's consider these options for the location of the EOS using specific examples.
Symptoms
EOS displacement itself does not have characteristic symptoms.
The diseases that accompany it can also be asymptomatic. That is why it is important to undergo an ECG for preventive purposes - if the disease is not accompanied by unpleasant symptoms, you can find out about it and begin treatment only after deciphering the cardiogram.
However, sometimes these diseases still make themselves felt.
Symptoms of diseases that are accompanied by a displacement of the electrical axis:
| LVH | Left bundle branch block |
| Attacks of chest pain, shortness of breath, arrhythmias, increases and changes in blood pressure, headaches and visual disturbances associated with increased blood pressure | Bradycardia (slow heartbeat), dizziness, and sometimes fainting |
But let us repeat once again - symptoms do not always appear; they usually develop in the later stages of the disease.
Normal position of the EOS
There are three options for the normal position of the EOS:
- horizontal position of the EOS with an angle from 00 to 300.
- normal position of the EOS with an angle equal to or about 600.
- vertical position of EOS from 700 to 900.
With a horizontal deviation of the EOS with an angle of 00, the maximum positive sum is R-(Q+S) in lead I, the maximum negative sum is R-(Q+S) in lead aVR. The algebraic sum of the waves R - (Q + S) is equal to or close to zero in lead aVF.
ECG 3. Normal (horizontal) position of the EOS. Angle is 0
ECG source.
With a normal EOS deviation with an angle of +300, the maximum positive sum is R-(Q+S) in leads I and II, the maximum negative sum is R-(Q+S) in lead aVR. The algebraic sum of the waves R - (Q + S) is equal to or close to zero in lead III.
ECG 4. Normal position of the EOS. The angle is +300
ECG source.
With a normal EOS deviation with an angle of +600, the maximum positive sum is R-(Q+S) in lead II, the maximum negative sum is R-(Q+S) in lead aVR. The algebraic sum of the waves R - (Q + S) is equal to or close to zero in lead aVL.
ECG 5. Normal position of the EOS. The angle is +600
ECG source.
With a vertical deviation of the EOS with an angle of +900, the maximum positive sum is R-(Q+S) in lead aVF, the maximum negative sum is R-(Q+S) in leads aVR and aVR. The algebraic sum of the waves R - (Q + S) is equal to or close to zero in lead I.
ECG 6. Normal (vertical) position of the EOS. The angle is +900
ECG source.
What is the electrical axis of the heart?
EOS is the total (prevailing) vector of all electrical impulses that are observed in the cardiac conduction system during one contraction cycle.
Often this indicator is identical to the electrical position of the heart (EPS) - the orientation of the resulting vector of impulses from the ventricles relative to the axis of lead I on the ECG. In the myocardium, like other muscles of the body, bioelectric currents (action potentials) arise during contraction. It is their electrocardiograph that registers and records them on specialized film in the form of an ECG.
The impulse is generated by the pacemaker (sinus node), from where the excitation reaches the atrium along the nerve pathways of the heart, and then the atrioventricular node (AV). This connection inhibits transmission so that contraction follows relaxation of the atria, which ensures one-way and continuous flow of blood through the cardiac chambers.
On an ECG, electrical impulses are displayed in the form of multidirectional teeth:
- positive – P, R, T – directed upward relative to the isoline;
- negative – Q, S.
An electrocardiographic recording is a recording of changes in potential differences during the process of excitation and relaxation of the atria and ventricles, caused by the electromotive force of the heart (EMF) from the surface of the human body.
EMF is an unstable value; its direction changes throughout the entire cardiac cycle. When summing up all the instantaneous orientations of the impulses (according to the rules of addition), a vector is obtained corresponding to the average EMF during the full period of depolarization - EOS (direction of the electric motor force during the registration of QRS on the ECG).
When recording an ECG, the electrodes are located in three leads that record the potential difference:
- I – left-right hand;
- II – left leg – right hand;
- III – left leg – left arm.
This placement forms a three-dimensional arrangement of EMF vectors on the torso, which forms the “Einthoven triangle”. If you put the EDS in this form, then the angle α (alpha) between the electromotive force and the horizontal of the first lead will express the deviation of the EOS.
Also, the angle α is approximately determined using the six-axis Bailey coordinate system or using special tables. In the absence of the above devices at hand, the orientation of the EOS is established by measuring the height of the R and S waves in standard leads I and III:
- RII=RI+RIII – normal axis location;
- RI>RII>RIII, SIII>RIII – left-sided deviation of the EOS;
- RIII>RI, SI>SIII – the EOS deviates to the right.
EOS deviation to the right
When the EOS deviates to the right with an angle of +1200, the maximum positive sum is R-(Q+S) in lead III, the maximum negative sum is R-(Q+S) in lead aVL. The algebraic sum of the R waves - (Q + S) is equal to or close to zero in lead aVR.
ECG 7. EOS deviation to the right. The angle is +1200
ECG source.
When the EOS deviates to the right with an angle of +1500, the maximum positive sum is R-(Q+S) in lead III, the maximum negative sum is R-(Q+S) in lead aVL. The algebraic sum of the waves R - (Q + S) is equal to or close to zero in lead II.
ECG 8. EOS deviation to the right. The angle is +1500
ECG source.
What is the resulting vector?
An electrocardiogram is a test that measures the electrical activity of the heartbeat. With each beat, an electrical impulse (or "wave") travels through the heart. This wave causes the muscle to contract and pump blood away from the heart. A normal heartbeat on an ECG will show the synchronization of the upper and lower chambers.
ECG waves are caused by depolarization, not contraction, of the heart. This wave of depolarization occurs before the heart muscle begins to contract. A normal ECG consists of 5 waves, labeled from left to right as P, Q, R, S, and T. The P, R, and T waves are usually upward or positive waves, while the Q and S are usually downward or negative waves.
The right and left atria or superior chambers form the first wave, called the “P wave.” The right and left lower chambers or ventricles produce the next wave called the “QRS complex.” The final wave or “T wave” represents the electrical recovery or return of the ventricles to a resting state.
The resulting vector is the sum of 3 moments of excitation: the base of the heart, its apex and the interventricular septum (Q + R + S).
The alpha angle on the ECG is the sum of the positive and negative wave numbers of the interventricular complex (Q + R + S).
The amount of voltage recorded on the ECG is directly proportional to the amount of depolarized tissue. The majority of the heart's mass is made up of the ventricular myocardium. Therefore, the largest recorded waveform, the QRS complex, the resulting vector, reflects ventricular depolarization.
In addition, because the mass of the left ventricle is significantly greater than that of the right ventricle, most of the QRS complex reflects left ventricular depolarization, and the orientation of the mean electrical axis is to the left of the interventricular septum.
A good mathematical tool to represent the lead measurement is a vector. A vector is an object that has both magnitude and direction, such as speed.
At any point in the cardiac cycle, a vector can represent the net electrical activity observed by a lead (a standard ECG is represented by 12 leads). An electrical vector has a magnitude, direction, and polarity and is usually represented graphically as an arrow.
Comparison of Q and S waves of the QRS complex
The complete QRS complex consists of the Q, R and S waves. However, all 3 waves may not be visible, and there are always differences between leads. Some leads can reflect all waves, while others can only reflect 1 wave. If the first wave is negative, then it is called a Q wave. If it is not negative, this means that the complex does not have this wave, regardless of the appearance of the QRS complex.
Any negative wave that occurs after a positive one is called an S wave.
The Q wave reflects the excitation of the left half of the interventricular septum.
The S wave is the deepest negative wave and indicates the terminal excitation of the base of the left ventricle.
The QS complex is not usually considered a sign of previous myocardial infarction. But there may be other causes, especially in older people, such as left ventricular hypertrophy.