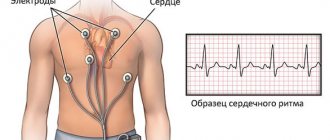
What is the ST segment?
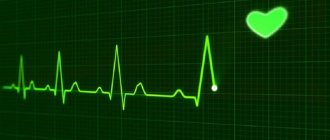
An ECG shows the electrical processes that occur in the heart muscle during contraction and relaxation. If you look at the result of the study, you can see a line with many teeth. A straight segment is called an isoline, and the distance between two adjacent teeth is called a segment.
The ST segment represents the interval from the end of the S wave to the beginning of the T wave. This segment shows the state of the heart muscle at the time of contraction of both ventricles. Normally, the segment lies completely on the isoline and does not deviate from it. If the segment is located below the isoline, then doctors talk about depression of the ST segment.
Does this indicate a dangerous heart pathology? It all depends on the degree and type of segment decline. The electrocardiograph records the examination results on checkered paper. If the ST segment is located no more than half a cell below the isoline, then this is a variant of the norm and occurs in healthy people. This result is considered acceptable in both precordial and limb leads. A stronger decrease in the segment may indicate cardiac pathology.
Indications for an ECG
In clinical practice, there are several indications for electrocardiography:
- severe chest pain
- constant fainting,
- dyspnea,
- exercise intolerance,
- dizziness,
- heart murmurs.
During a routine examination, an ECG is a mandatory diagnostic method. There may be other indications determined by the attending physician. If you experience any other alarming symptoms, consult your doctor immediately to determine their cause.
Why is the ST segment reduced?
The causes of ST segment depression are divided into coronary and non-coronary. Coronary causes include conditions associated with insufficient blood supply (ischemia) to the heart muscle. These are different types of coronary heart disease and myocardial infarction. Non-coronary causes include:
- lack of potassium in the body (hypokalemia);
- secondary myocardial lesions in non-cardiac pathology;
- paroxysmal supraventricular tachycardia (ST segment depression can be up to 8 mm);
- taking certain medications (cardiac glycosides, antiarrhythmics, phenothiazines);
- hypertrophy of the left ventricle of the heart;
- vegetative dystonia;
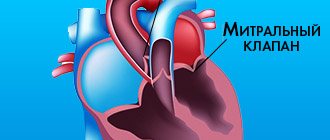
- mitral valve prolapse;
- emotional stress;
- intense breathing (hyperventilation).
Pathological ECG parameters
The ECG in normal and pathological conditions is significantly different. Therefore, it is necessary to carefully approach the decoding of the heart cardiogram.
QRS complex
Any abnormality in the electrical system of the heart causes a prolongation of the QRS complex. The ventricles have greater muscle mass than the atria, so the QRS complex is significantly longer than the P wave. The duration, amplitude, and morphology of the QRS complex are useful in identifying cardiac arrhythmias, conduction abnormalities, ventricular hypertrophy, myocardial infarction, electrolyte abnormalities, and other disease conditions.
Q, R, T, P, U teeth
Abnormal Q waves occur when an electrical signal passes through damaged heart muscle. They are considered markers of previous myocardial infarction.
R-wave depression is also usually associated with myocardial infarction, but it can also be caused by left bundle branch block, WPW syndrome, or hypertrophy of the lower chambers of the heart muscle.
T wave inversion is always considered an abnormal value on the ECG tape. Such a wave may be a sign of coronary ischemia, Wellens' syndrome, hypertrophy of the lower cardiac chambers, or a central nervous system disorder.
A P wave with increased amplitude may indicate hypokalemia and right atrial hypertrophy. Conversely, a P wave with reduced amplitude may indicate hyperkalemia.
U waves are most often observed with hypokalemia, but may also be present with hypercalcemia, thyrotoxicosis, or taking epinephrine, class 1A and 3 antiarrhythmic drugs. They are often found in congenital long QT syndrome and intracranial hemorrhage.
An inverted U wave may indicate pathological changes in the myocardium. Another U-wave can sometimes be seen on ECGs in athletes.
Read also: Is Doppler ultrasound diagnostics harmful during pregnancy?
QT, ST, PR intervals
QTc prolongation causes premature action potentials during late phases of depolarization. This increases the risk of developing ventricular arrhythmias or fatal ventricular fibrillation. Higher rates of QTc prolongation are observed in women, older patients, hypertensive patients, and short people.
The most common causes of QT prolongation are hypertension and certain medications. The duration of the interval is calculated using the Bazett formula. With this symptom, the interpretation of the electrocardiogram should be performed taking into account the medical history. This measure is necessary to eliminate hereditary influence.
ST interval depression may indicate coronary ischemia, transmural myocardial infarction, or hypokalemia.
A prolonged PR interval (greater than 200 ms) may indicate first-degree heart block. Prolongation may be associated with hypokalemia, acute rheumatic fever, or Lyme disease. A short PR interval (less than 120 ms) may be associated with Wolff-Parkinson-White syndrome or Lown-Ganong-Levine syndrome. PR segment depression may indicate atrial injury or pericarditis.
Oblique and horizontal type of decline
If the segment between the teeth is an oblique line directed downwards, then in this case they speak of oblique depression of the ST segment. Such electrocardiogram readings are considered pathological. This indicates myocardial ischemia. Another reason for this result may be left ventricular failure.
A sign of insufficient blood supply to the heart muscle is horizontal depression of the ST segment. What it is? The segment between the S and T teeth is parallel to the isoline. This ECG result is also a marker of ischemia.
The status of the ST segment is checked in two adjacent leads. That is, the electrodes of the cardiograph are connected to two points located nearby, on the chest or on the limbs. And if a decrease in the segment was detected twice, then this, as a rule, indicates ischemia.
How to decipher a cardiogram of the heart?
A strict plan for deciphering an ECG consists of analyzing the resulting graph. In practice, only the total vector of the QRS complex is used. The work of the heart muscle is presented in the form of a continuous line with marks and alphanumeric designations. Any person can decipher an ECG with certain training, but only a doctor can make the correct diagnosis. ECG analysis requires knowledge of algebra, geometry and an understanding of letter symbols.
Not only cardiologists, but also general practitioners (for example, paramedics) have to read ECGs and make conclusions. Timely interpretation of the ECG makes it possible to provide effective first aid to victims.
ECG indicators that need to be taken into account when interpreting the results:
- intervals,
- segments,
- teeth.
There are strict indicators of normality on the ECG, and any deviation is already a sign of disturbances in the functioning of the heart muscle. Pathology can only be excluded by a qualified specialist - a cardiologist.
Oblique descent type
Oblique ST-segment depression is a deviation in the electrocardiogram when the line between the teeth is directed upward. This usually happens with tachycardia. This phenomenon may be temporary, for example when your heart rate increases after exercise. In this case, changes in the electrocardiogram do not indicate pathology.
But if a high T wave is observed on the electrocardiogram along with oblique ST segment depression, this may indicate a disease. This ECG result occurs in the acute stage of myocardial infarction, with left ventricular hypertrophy, hyperkalemia.
Clinical manifestations
The clinical picture of ST segment elevation may be different. It depends on the reason that caused the change.
Pain
The most common symptom accompanying ST segment elevation is pain. The intensity of pain, its duration, irradiation (conducting pain to other organs and parts of the body) can vary.
Pain during angina pectoris and myocardial infarction is usually acute and very severe. It is impossible to endure such pain. By nature it can be burning, squeezing, pressing.
The localization of pain can also be different. Most often it is localized behind the sternum, directly in the heart area. If a heart attack affects the lower wall of the heart, the epicenter of pain may be the abdomen, which is why patients mistakenly turn to a gastroenterologist.
Often the pain is not localized in one place, but radiates along the nerves. In this case, pain in the heart can radiate to the left arm, shoulder blade, shoulder, or little finger. Cases have been described where the only symptom of myocardial infarction was pain in the little finger.
One of the main criteria for differentiating pain during angina pectoris and pain during myocardial infarction is time. Pain during angina pectoris lasts no more than 15 minutes; in all other cases, a heart attack should be suspected.
Pain from pericarditis is usually similar to pain from myocardial infarction. It has the same localization, the same areas of conduction. It is characterized by intensification in a horizontal position (lying down), when eating or drinking water (swallowing is especially difficult for patients), and when coughing. Sometimes there is an increase in pain during breathing.
Dyspnea
Dyspnea is the equivalent of pain in conditions accompanied by ST segment elevation on the ECG. It can occur at rest or during physical activity. This symptom can occur with myocardial infarction, myocarditis, or cardiac aneurysm.
Fever (increased body temperature)
This nonspecific symptom accompanies many human diseases, and ST segment elevation can also manifest itself as an increase in body temperature.
Excessive sweating
It is observed in myocardial infarction, aneurysm and other conditions accompanied by ST segment elevation on the ECG.
Heart rhythm disturbances
This symptom can be subjectively felt as increased or, conversely, weakened heartbeat, interruptions in heart function.
Weakness
General weakness and weakness of skeletal muscles may also indicate the presence of heart disease accompanied by ST segment elevation.
Asymptomatic
In some cases, ST elevation may not manifest itself clinically. This situation is especially dangerous, since some conditions accompanied by ST segment elevation on the ECG are often life-threatening and require emergency medical care.
Cardiac axis
The cardiac axis represents the general direction of the heart's electrical alignment.
In a healthy person, the axis should be directed from 11 o'clock to 5 o'clock (if assessed by the dial).
To determine the cardiac axis, you need to look at standard leads I, II and III.
With a normal cardiac axis:
- Lead II has the most positive deviation compared to leading leads I and III
When deviating to the right:
- Lead III has the most positive deflection, and lead I should be negative.
A similar change is usually observed in individuals with right ventricular hypertrophy.
When the axis is deflected to the left:
- Lead I has the greatest positive deviation.
- Leads II and III are negative.
Left axis deviation is observed in individuals with cardiac conduction disorders.
Video: ECG norm (Russian voiceover)
Heart rhythm
Heart rhythm may be regular or irregular.
Irregular rhythms may be:
- Regularly irregular (i.e., the pattern of irregularity repeats).
- Irregularly irregular (the rhythm is completely disorganized).
You can distinguish a regular rhythm from an irregular one as follows: Several consecutive RR intervals are marked on a piece of paper. The rhythm bars are then moved along them to check if the next intervals match.
The nuance of deciphering the ECG: If there is a suspicion that there is some kind of atrioventricular block, you need to indicate separately the speed of contraction of the atria and ventricles (i.e., P-waves and R-waves are noted separately. When movement occurs along the rhythm strip, then you can see whether the PR interval changes.
A similar change can be observed in the absence of QRS complexes or complete dissociation between them. If you additionally measure the RR intervals, then you can find out whether the rhythm is regular or irregular.
Examples of heart rate descriptions and ECG interpretation
Normal sinus rhythm
Sinus rhythm is any heart rhythm in which the excitation of the heart muscle begins from the sinus node. It is characterized by correctly oriented P waves on the ECG. By convention, the term "normal sinus rhythm" includes not only normal P waves, but also all other ECG measurements.
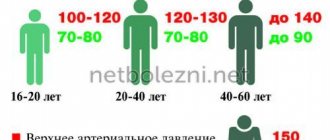
ECG norm in adults:
- heart rate from 55 to 90 beats per minute,
- regular rhythm
- normal PR interval, QT and QRS complex,
- The QRS complex is positive in almost all leads (I, II, AVF and V3-V6) and negative in aVR.
Sinus bradycardia
A heart rate less than 55 in sinus rhythm is called bradycardia. ECG interpretation in adults should take into account all parameters: sports, smoking, medical history. Because in some cases, bradycardia is a variant of the norm, especially in athletes.
Pathological bradycardia occurs with weak sinus node syndrome and is recorded on the ECG at any time of the day. This condition is accompanied by constant fainting, pallor and hyperhidrosis. In extreme cases, pacemakers are prescribed for malignant bradycardia.
Signs of pathological bradycardia:
- heart rate is less than 55 beats per minute,
- sinus rhythm,
- P waves are vertical, consistent and normal in morphology and duration,
- PR interval from 0.12 to 0.20 seconds,
- QRS complex less than 0.12 seconds.
Sinus tachycardia
A regular rhythm with a high heart rate (above 100 beats per minute) is commonly called sinus tachycardia. Note that normal heart rate varies depending on age; for example, in infants, the heart rate may reach 150 beats per minute, which is considered normal.
Read also: Methodology for duplex scanning of blood vessels
Advice! At home, severe coughing or pressing on the eyeballs can help with severe tachycardia. These actions stimulate the vagus nerve, which activates the parasympathetic nervous system, causing the heart to beat slower.
Signs of pathological tachycardia:
- Heart rate above one hundred beats per minute,
- sinus rhythm,
- P waves are vertical, consistent and normal in morphology,
- The PR interval fluctuates between 0.12-0.20 seconds and shortens with increasing heart rate,
- QRS complex less than 0.12 seconds.
Atrial fibrillation
Atrial fibrillation is an abnormal heart rhythm characterized by rapid and irregular contraction of the atria. Most episodes are asymptomatic. Sometimes an attack is accompanied by the following symptoms: tachycardia, fainting, dizziness, shortness of breath or chest pain. The disease is associated with an increased risk of heart failure, dementia and stroke.
Signs of atrial fibrillation:
- Heart rate is constant or accelerated,
- no P waves
- electrical activity is chaotic,
- RR intervals are irregular,
- QRS complex less than 0.12 seconds (in rare cases, the QRS complex lengthens).
Important! Despite the above explanations with the decoding of the data, an ECG conclusion should only be made by a qualified specialist - a cardiologist or a general physician. Decoding the electrocardiogram and differential diagnosis requires higher medical education.