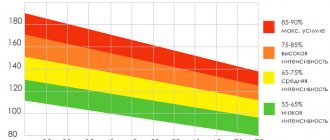
Sphygmography is a modern procedure that is aimed at measuring arterial pulse and related indicators of the cardiovascular system. Using a special device, the frequency and rhythm of the pulsating wave, as well as the level of filling of the artery, are determined. Based on the results obtained, an accurate diagnosis is established and effective treatment is prescribed.
Modern procedure
A sphygmograph is a device that allows you to diagnose the arterial pulse. During monitoring, the device records systolic and diastolic pressure, volumetric indicators of the heart valves and general indicators of vascular patency. The procedure is carried out only as prescribed by the attending physician: therapist, cardiologist or surgeon.
The procedure can only be performed by a specialist doctor who studies problems of the cardiovascular system. The result of the procedure is a sphygmogram. This is a curved line, each part of which is responsible for different pressure inside the vessels. The curve characterizes the arterial pulse and any deviations from the norm in the functioning of the cardiovascular system.
Content:
- Modern procedure
- Feasibility of sphygmography
- Purpose of the procedure
- Sphygmography indicators
- Contraindications to the procedure
- Carrying out the procedure
- Decoding the results
- What does the procedure determine?
- Additional Methods
The type of sphygmogram depends on the area that needs additional examination. The central pulse is measured to determine the pressure in the carotid artery. The data obtained allow us to estimate the pressure inside the vessels (systole and diastole). Peripheral pulse measurement is carried out on the arteries of the upper extremities. Peripheral pressure is measured on the arteries of the leg only in cases where manipulation in the arm area is contraindicated for the patient.
Types of sphygmography and sphygmogram
Sphygmography itself
registers vibrations of a vessel in an area of the body using a receiver that is strictly fixed above the artery, without exerting significant pressure on its walls. Such a study is possible only where the arteries are located superficially, and at those points where the pulse is usually palpated.
The so-called volumetric sphygmography
determines the total volumetric changes in the neck (or limb) of the patient, on which a compression (for the neck - narrow, with a chamber measuring no more than half the circumference) pneumatic cuff is placed (according to the above GOST, a device for measuring the dependence of the volume of an organ or part of the body during blood filling on time is called “plethysmovasograph”). In the middle of the 20th century, it was believed that volumetric sphygmography occupies an intermediate position between sphygmography and plethysmography. In modern literature, the term “volume sphygmography” or “volume sphygmography” can be found only in a small number of publications by Russian authors, and this term is not currently used in the global community of researchers.
You can also find the term volumetric segmental sphygmography
, that is, registration of volumetric changes in any part of the body accessible for application of the cuff. The most important indicator when performing OSPG is the measurement of the speed of propagation of the pulse wave in the elastic and muscular arteries. Arteries of the elastic type include the aorta, subclavian, carotid and pulmonary arteries, and arteries of the muscular type include the brachial, radial, femoral and crural arteries.
Compression cuff techniques can be multi-channel
, when several cuffs are used for different limbs (usually in a laboratory setting), or
single-channel
, as in devices combining oscillometric sphygmomanometry and obtaining peripheral and central sphygmograms (used both for ambulatory monitoring of pulse waves and for their analysis in a doctor’s office setting) .
There are sphygmograms of the central
and
peripheral pulse
. A sphygmogram of the central pulse is made on the subclavian and carotid arteries, or using special transformations it is restored from the peripheral pulse curve. The peripheral pulse is examined in the femoral, radial, and foot arteries and with volumetric sphygmography.
The carotid artery sphygmogram can be recorded synchronously with the electrocardiogram and phonocardiogram (polycardiography).
Feasibility of sphygmography
The procedure prescribed by a specialist helps to assess the condition of large and small vessels in the human body. Using the technique, the patency and tone of the arteries is determined (their condition determines the functioning of the entire circulatory system). The purpose of diagnosis is to determine the state of the system that should supply the body tissues with blood. Violation of the basic function of the circulatory system leads to diseases of the heart and internal organs. Using the procedure, heart failure is detected (the degree of failure and circulatory disorders in the internal organs is determined).
Purpose of the procedure
Patient complaints are the primary reason for visiting a doctor; they are a direct indication for the procedure. Dizziness and headaches, which bring a lot of suffering to the patient, are symptoms for prescribing central pulse measurement. Indicators of the central pulse are determined if the patient experiences absent-mindedness, lack of concentration, sudden mood swings (excitability and apathy), and impaired coordination of movement. Symptoms that are not connected with each other are an alarming sign that indicates a violation of the blood supply in the human body.
The peripheral pulse is measured if the patient's arms and legs often go numb (extremities may become numb individually). If they are cold and the patient complains of pain in the fingers, he is prescribed sphygmography. Peripheral pulse is determined in the case of atrophy of fat and subcutaneous tissue or atrophy of muscle tissue. If the patient gets tired quickly and feels constant weakness in the limbs, the attending physician refers him to additional examinations, including sphygmography, to measure the peripheral pulse. The direct indication for the procedure is pain in the legs while walking - the pain does not go away, but only intensifies over time.
Sphygmography indicators
Sphygmography monitors several important parameters at once: frequency, pulse rhythm, systole and degree of vessel filling. Using a simple device, upper and lower blood pressure is measured, which allows an accurate diagnosis of hypertensive patients. The stroke volume of the heart demonstrates its work (how quickly the heart pumps blood into the bloodstream in one contraction).
Using the installation, the functioning of the heart valves is assessed - sphygmography is an auxiliary procedure in identifying dangerous defects and pathologies. If the attending physician's concerns are confirmed, the patient is referred for further research. Sphygmography determines the stiffness of the arteries. This indicator helps to identify atherosclerotic diseases.
Diagnostics
Sphygmography allows you to determine:
- Determination of patency of peripheral vessels;
- Properties of the pulse: frequency, rhythm, filling, tension, height;
- Increase or decrease in blood pressure relative to normal levels;
- Decrease in vascular resistance;
- The speed of propagation of the pulse wave is an indicator of the stiffness of the arteries and their possible damage by atherosclerosis.
- Aortic heart disease.
- Stroke volume of the heart using the Wetzler-Beger or Bremsel-Ranke method.
Contraindications to the procedure
There are no direct contraindications to the procedure. If the patient complains of numbness in the arms and legs, he is referred for sphygmography. This procedure is indicated at any age and in the presence of any diseases in the patient (chronic and protracted illnesses). An installed pacemaker is not a direct contraindication to the procedure - an experienced doctor assesses the risks of conducting the study for such patients.
The purpose of the procedure takes place in several stages:
- consultation with the attending physician takes place;
- the patient undergoes additional examinations of the body;
- general blood tests are taken;
- sphygmography is performed;
- Additional examination methods are prescribed to determine an accurate diagnosis.
In most cases, the procedure takes place without complications or side effects - sphygmography does not cause acute allergic reactions or additional symptoms. Less commonly, the procedure is prescribed to children and pregnant women. If necessary, the child undergoes a pulse measurement using a special device in the presence of parents.
Preparation and technique
The rules for preparing for sphygmography are similar to the rules for preparing for measuring blood pressure (sphygmomanometry). Some time before sphygmography, it is necessary to exclude factors that affect the patient’s pulse and blood pressure: mental stress (also during the study), food intake (1 hour), physical activity, consumption of tonic drinks (tea, coffee, cocoa), taking medications from the sympathomimetic group, smoking (1.5-2 hours before), drinking alcohol.
The main position of the patient's body is lying on his back. The arms are slightly spread to the sides, the head is slightly raised (on the pillow).
When examining the carotid artery, the head is slightly moved to the side, the neck muscles are relaxed. The pelot or funnel is placed at the level of the upper edge of the thyroid cartilage or higher under the lower jaw, depending on the location of the best pulsation, determined by palpation. Sphygmography of the femoral artery is determined in the upper third of the anterior surface of the thigh (Scarpa's triangle).
To obtain a sphygmogram of the extremities, it is more convenient to use a cuff that is placed on the patient’s shoulder, forearm, thigh or lower leg; in the case of outpatient monitoring, preparation and recommendations to the patient are the same as for 24-hour blood pressure monitoring.
Pulse wave propagation velocity (PWV) is determined either by simultaneous recording of sphygmograms of two or more arteries, or by dividing the pulse wave contour in one artery (using special algorithms) into direct and reflected waves. Various pulse wave analysis techniques can also obtain central blood pressure and augmentation index values.
Carrying out the procedure
The procedure is carried out within 10-15 minutes and does not bring any discomfort to the patient. The doctor chooses the appropriate place to measure the pulse: the radial artery or the artery in the lower leg. The choice of a suitable location for installing the sensors depends on the problem with which the patient presented. Modern techniques use strain gauge or capacitive sensors, which are highly durable and reliable.
The sensor reads information - the frequency and rhythm of pulsating blood, and then transmits this data to a recording device. Sphygmography is the recording of blood vibrations that pass through vessels (a pulsating wave passes along the walls of the vessel and creates a certain vibration frequency).
There are differences between measuring peripheral and central pulses. In the first case, the results obtained show the main and additional waves (two important indicators). The measurement of the pulse wave and its intensity is carried out using a comprehensive study based on the synchronization of the operation of two installations (on the carotid and femoral arteries).
At the end of the study, the results obtained are compared: based on the difference in sphygmograms and additional measurements (vessel length and wave speed), the functioning of the cardiovascular system and disorders that cause unpleasant symptoms are determined. To diagnose muscular arteries, the pulse on the carotid and radial arteries is synchronized. Normally, the speed of the wave passing through the vessels is from 4 to 8 m/s.
Story
Sphygmograph Mare.
Illustration from the 1881 book Sphygmography traces its history to the invention of the sphygmograph in 1854 by the German physician Karl von Vierordt (1818-1884). The first devices for recording pulse (and there were several varieties) were completely mechanical.
Some Russian scientific medical schools still use the term “sphygmography”, extending it to various methods of recording pulse waves in blood vessels, while in other countries the use of this term ceased with the disappearance of mechanical sphygmographs (the term is used only in a historical aspect), and research methods are named according to the principle of obtaining the recording, for example, applanation tonometry of the carotid and femoral arteries, echo tracking, etc. Probably, Russian traditions are supported by the outdated GOST adopted in the USSR in the early 70s of the 19th century, which, however, does not define “sphygmograph”, but gives separate definitions of “sphygmoarteriograph” and “sphygmophlebograph”.
Decoding the results
The curve - the result of sphygmography - is displayed on the screen. It is registration information about the frequency and rhythm of the pulse. This curve consists of several parts, which are analyzed by the doctor. These indicators help establish an accurate diagnosis without additional research methods.
Best materials of the month
- Coronaviruses: SARS-CoV-2 (COVID-19)
- Antibiotics for the prevention and treatment of COVID-19: how effective are they?
- The most common "office" diseases
- Does vodka kill coronavirus?
- How to stay alive on our roads?
Anacrota represents the beginning of the curve. The line is always directed upward and reflects the phase of blood circulation when blood is thrown into the vessel. The release occurs from the heart valve, which immediately fixes the device. Defects or abnormalities in anacrota indicate problems with the heart and adjacent vessels.
The incisura is the second part of the measured curve, which records the diastolic pressure of the ventricles. At the moment when this indicator is recorded, the heart valve is completely closed, and the pressure in the vessel automatically decreases.
The dicrotic wave is an indicator of the pressure directly in the aorta. The flow of blood causes the valves to close and, due to pressure, flows back into the aorta (pressure increases). The last indicator displayed on the curve, catacrota, is the descending line that completes the sphygmography. From this part of the line one can judge the outflow of blood to the peripheral parts of the body, into small vessels. This process is accompanied by a decrease in pressure in the part being studied.
Sphygmograph
Main article: Sphygmograph
A sphygmograph is a device for obtaining a sphygmogram, a graphical display of the properties of the pulse. The sphygmograph consists of a receiver of mechanical vibrations of the artery, a transducer and a recording device. The sensitive element of the sphygmograph is a sensor (receiver) in the form of a pilot with a lever acting as a transducer (as in the Mare sphygmograph). At the beginning and middle of the 20th century, photoelectric, electromagnetic, piezocrystal or strain gauge sensors were used to convert mechanical signals, and an electrocardiograph with ink recording was used as a recording device.
What does the procedure determine?
A sphygmogram is a visual picture of what happens in a vessel as blood passes through. Using the data obtained, analyzing the curve, the doctor can suspect atherosclerosis at any stage of development (minor accumulation of atherosclerotic plaques and serious blockages of blood vessels). When the tone or elasticity of the vascular walls decreases, changes in the resulting curve are observed. A sphygmogram indicates problems with blood supply in the part of the artery being examined.
Vasculitis and age-related changes in blood vessels are diagnosed using complex sphygmograms made in different areas of interest. Using the procedure, you can see blood pressure disorders and take emergency measures to eliminate the problem.
The curve is used to diagnose aortic valve stenosis and insufficiency of this valve, which threatens the patient’s life. Heart failure is determined using several research methods, including sphygmography. The results are deciphered by a doctor who examines problems of the cardiovascular system, but determining the diagnosis is the task of the attending physician. He writes orders for the procedure and evaluates the results obtained in addition to other research methods.
Sphygmogram
Sphygmogram (diagram) of the carotid artery (central pulse).
ab - Anacrota, bc - Plateau, cf - Catacrota, cde - Incisura, e - Dicrotic rise. Systolic waves: b - shock (direct), c - residual (reflected) Sphygmogram
- the result of sphygmography in the form of a pulse curve, which is used to determine the properties of the pulse and diagnose the state of the cardiovascular system.
Elements of a sphygmogram:
Anacrota
— interval of pulse wave rise. During systole of the left ventricle of the heart, a portion of blood (50-90 ml) is sharply ejected into the aorta and disperses further through the arteries. At the peak of anacrotism (at point b in the figure), systolic blood pressure is recorded.
Catacrota
— wave fall interval. Occurs during the outflow of blood from the arteries into the capillaries. At the lowest point of the catacrota (point a), diastolic blood pressure is recorded.
Dicrotic rise (tooth)
— secondary rise on catacrota.
During the closure of the aortic valve (section cd), the pressure in the arteries begins to drop sharply, as blood briefly flows in the opposite direction to the heart, but after the complete closure of this valve, it again rushes into the aorta (section de). The moment of complete closure of the valve on the sphygmogram corresponds to the lowest point of the incisura (notch)
(point d). After the dicrotic rise, the pressure drops more slowly (section ef).
Additional Methods
For a complete picture of the disease, sphygmography is not enough. The obtained indicators demonstrate the functioning of blood vessels, but do not always show the cause of malfunctions in the cardiovascular system. For a comprehensive examination, ECG and echocardiogram (electrocardiogram and echocardiogram) are used. Angiography allows you to assess the degree of complication of the disease and identify its root cause. Sphygmography is an auxiliary diagnostic method that does not exclude additional techniques and examinations.
For each vessel, a norm for blood passage is established: deviations from the norm may depend on the individual characteristics of the patient’s body. For the radial artery, this norm is from 6 to 12 m/s. Using a mechanocardiograph, it is possible to measure the pulse in two parameters at once. During the period of treatment, such comprehensive diagnostics can determine the dynamics of the prescribed therapy. The appointment of a comprehensive diagnosis is carried out by the attending specialist, who assesses the advisability of a repeat procedure. The absence of contraindications allows several sphygmographies to be performed per year.
More fresh and relevant information about health on our Telegram channel. Subscribe: https://t.me/foodandhealthru
We will be grateful if you use the buttons:
Photoelectric sphygmography using the E14-140 module
Implementation: 2021
Specialists from two Kharkov universities created an experimental setup based on the E14-140 ADC module, which implements the classical method of obtaining a sphygmogram, as evidenced by the article [1], published in the international scientific and practical journal “Photobiology and Photomedicine”.
Below are excerpts from this article. Photoelectric sphygmography is a graphical recording of pulse oscillations of blood vessels using an optical-electric LED-photodiode pair installed on areas of the body with clearly defined pulsation of the arteries. The signal is generated due to a change in blood volume at the indication site, which is accompanied by a change in the optical density of the measured area. The optical sensor usually operates in the red and near-infrared regions of the spectrum - the transparency band of biological tissue. The most convenient place to place the sensor is a finger (Figure 1). The shape of the pulse wave (Figure 2), which is recorded by the optical sensor, is determined by the contractility of the left ventricle of the heart and the viscoelastic properties of large arteries. The elastic properties of the aorta have the maximum influence on signal formation.
Figure 1. Layout of the finger in the optical sensor.
Pulse cardiac load and the presence of vascular branch points (bifurcations) determine the specificity of intravascular hemodynamics. At the bifurcation points, the hydraulic resistance of the vessels changes abruptly, and reflected waves are formed, which are superimposed on the direct wave. Figure 3 (upper graph) shows a diagram of the superposition of direct and reflected waves for elastic arteries, and Figure 3 (lower graph) for rigid arteries (with reduced elasticity of the walls). In the latter case, the systolic blood pressure formed by the left ventricle receives an additional increase (augmentation), which is clearly manifested in the elderly.
Figure 2. Scheme of pulse wave formation. | Figure 3. Superposition of direct and reflected pulse waves. |
Analysis of a sphygmogram includes a temporal analysis of individual elements of the sphygmogram and a description of the shape of the curve, which is very characteristic of some diseases. The classification is based on the time interval between the direct and reflected waves. Variants of sphygmogram curves can be divided into 4 types (Figure 4). These factors are a prerequisite for the use of sphygmograms in determining the biological age of a person, as well as the recognition of pathologies based on the analysis of differences between the sphygmogram of the examined object and the normal sphygmogram.
Figure 4. Types of pulse waves: type 1, recorded in young people; 2-3 types – in older age groups of people; Type 4 – high rigidity of the aortic walls.
The experimental setup implements the classic method of obtaining a sphygmogram using a pair of LED-photodiode. The block diagram of the experimental setup is shown in Figure 5. The thumb, index or middle finger of the hand is placed between the LED LED and the PD photodiode.
Figure 5. Block diagram of the experimental setup: LED – LED, BP – LED power supply, PD – photodiode, ADC – analog-to-digital converter E14‑140, PC – personal computer.
The most suitable spectral regions for obtaining a sphygmogram are orange and red. Here, the depth of radiation penetration into the tissue is about 10 mm. The radiation passes through the entire object. Its absorption is significant, so that changes in the optical density of the object, associated with changes in the volumetric velocity of blood, noticeably affect the intensity of the transmitted light. The installation used a red LED with a radiation power of about 10 mW. At this power, the amplitude of the signal from the photodiode was several millivolts. The signal was recorded by the E14‑140 ADC and entered into the computer. A general view of the installation is shown in Figure 6.
Figure 6. Experimental setup: 1 – LED, 2 – photodiode, 3 – E14-140 analog-to-digital converter, 4 – computer.
Primary signal processing is carried out using the PowerGraph program. Further mathematical processing of the signal is carried out using the Mathcad program. The coordinates of the characteristic points of the sphygmogram and the distances between these points are determined using the Trace function. Figure 7 shows the Mathcad program window and the crosshair of the Trace function, which is located at one of the maxima of the sphygmogram (top graph). The derivative du(t)/dt graph (lower graph) helps to more accurately determine the position of the maximum.
Figure 7. Mathcad program window.
To test the algorithm, an analysis of two objects was carried out; object 1 is a girl aged 23 years, object 2 is a man aged 77 years. Characteristic qualitative differences between the graphs are visible. In the sphygmogram of object 1, the signal increases quickly, the maximum is sharp, there are two secondary maximums. In the sphygmogram of object 2, the signal changes are slower. This is explained by the fact that with increasing age, the walls of blood vessels become more rigid and less deformed under the influence of blood pressure.
Figure 8. Sphygmograms of the studied objects (in red): a – object 1 (age 23 years), b – object 2 (age 77 years). Blue color – derivative graphs. The abscissa axis shows time in seconds, the ordinate axis shows the signal value in millivolts (two cells - 1 mV).
Conclusions:
- Using a pair of LED-photodiode, a sphygmogram signal was obtained, which, along with the signals of the electrocardiogram and cardiointervalogram, provides information about the physical state of the object under study and its biological age.
- An algorithm for processing sphygmogram signals has been developed, based on measuring the geometric characteristics of the pulse. PowerGraph and Mathcad programs were used to implement the algorithm. The performance of the algorithm was tested by analyzing the sphygmograms of two people.
- The advantages of the method are the simplicity of its hardware and mathematical processing apparatus for a large amount of information received.
Source: Kokodiy N.G., Shaposhnikova A.V., Kaidash M.V., Timanyuk V.A. Mathematical analysis of sphygmogram // Photobiology and photomedicine. – 2021. – Volume 14, No. 1, 2. – P. 87‑94.