Stages of development of a heart attack with ST segment elevation
The most acute stage of STEMI
First, a high coronary T appears on the cardiogram. The high coronary T before ST elevation is present for a very short time, so it is not always possible to register it. Then there is an increase in the ST segment, which merges with a high T.
Scheme 2. ECG fragments in the most acute stage of STEMI
Acute stage STEMI
Lasts up to 2-3 days (sometimes up to 2 weeks). The beginning of the acute phase is considered to be the appearance of the Q wave, which reflects the formation of a zone of myocardial necrosis. As the acute phase develops, the Q wave deepens, and the ST segment begins to decline towards the isoline. The T wave becomes negative.
Scheme 3. ECG fragment in the acute stage of STEMI
Subacute stage of STEMI.
Lasts for several weeks. The ECG records a decrease in the ST segment to the level of the isoline. At the same time, a deep negative T wave is formed.
Scheme 4. ECG fragment in the subacute stage
Scar stage STEMI
Dead myocardial cells are replaced by connective tissue, which leads to the formation of a scar. The areas of the myocardium surrounding the scar undergo compensatory hypertrophy. The number of leads on the ECG in which changes associated with a heart attack are recorded is reduced. The Q wave may become less deep, and the T wave returns to the baseline. The formed picture of post-infarction cardiosclerosis on the ECG persists throughout the patient’s life.
Sometimes the ST segment does not reach the isoline and remains elevated almost throughout life. As a rule, the QRS complex takes on the QS form, which may indicate the formation of a cardiac aneurysm.
Scheme 5. ECG fragments with post-infarction changes
Diagram 5 on the left shows a fragment of a cardiogram indicating a myocardial infarction. On the right is a fragment of a cardiogram in which the ST segment has not reached isolia and a QS complex has formed, turning into increased ST. This picture is called a “frozen ECG” and indicates a post-infarction cardiac aneurysm.
What it is
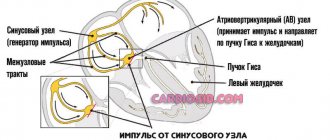
The human heart consists of 2 types of cells - typical cardiomyocytes (muscle cells that provide contraction) and atypical cardiomyocytes (generating and conducting nerve impulses).
Thanks to the activity of the latter, the heart is capable of constant and rhythmic contraction. This is called automaticity. At the moment when the heart is at rest (not contracting), positively charged particles (cations) are located outside the cardiomyocyte membrane, and negatively charged particles (anions) are located inside.
When ions begin to move through special channels, the charge of the membrane changes (inside to “+”, outside to “-”). As soon as the charge difference reaches a certain value, an excitation wave is generated (depolarization occurs), which is transmitted to the muscle cells, and the heart contracts. Then the ions return to their original place (the myocardium relaxes), and the cycle repeats again. This moment of reverse movement of ions is called repolarization.
Repolarization disorder is a very common phenomenon among both adults and children (more often in males). Moreover, it can be observed both in absolutely healthy people and in those who suffer from severe cardiac diseases.
A special type of this pathology is distinguished - early myocardial or ventricular repolarization syndrome (ERRS) , which is mainly found in adolescents and even newborns who do not have any heart disease. SRS can also be found in adults.
Localization of infarction with ST elevation
Changes in cardiograms during a heart attack with ST segment elevation vary depending on which part of the heart the heart attack develops in. The location of the infarction can be determined by the ECG leads in which ST elevation is recorded and in which leads reciprocal ST depression appears. In this regard, remember which leads correspond to different parts of the myocardium. Look at diagram 6.
Scheme 6. Correspondence of cardiogram leads to different areas of the myocardium.
Schema source.
Diagram 7 below shows the location of large coronary arteries, the occlusion of which can lead to transmural infarction with appropriate localization.
Scheme 7. Large coronary arteries
| Localization of infarction | ST elevation leads | Leads with reciprocal ST depression |
| Interventricular septum | V1-V2 | |
| Front wall | V3-V4 | |
| Lateral wall of the left ventricle | I, aVL, V5-V6 | III, aVF |
| Bottom wall | II, III, aVF | I, aVL |
| Back wall | V7-V9 | V1-V3 (and high R in V1-V3) |
| Right ventricle | V1, III, II (STIII > STII), V3R - V5R | V2 |
The table above shows which leads show ST elevation or depression depending on the location of STEMI. In practice, ST elevation infarction usually affects more than one area. For example, an infarction of the interventricular septum is usually combined with an infarction of the anterior wall of the left ventricle. In this case, ST elevation will be not only in leads V1-V2, but also in V3-V4.
Let's consider STEMI options with different localizations.
Prevention of the development of myocardial fibrosis
Vladimir Trofimovich Ivashkin , academician of the Russian Academy of Medical Sciences, Doctor of Medical Sciences:
– Dear colleagues, I give the floor to Oksana Mikhailovna Drapkina with a message, which, in my opinion, is dedicated to the dreams of modern cardiologists about the prevention of the development of fibrosis
Oksana Mikhailovna Drapkina , professor, doctor of medical sciences:
- Thank you. On the first slide we see that the title of the lecture ends with the question: “Prevention of myocardial fibrosis. Where to begin?". Indeed, Sergei Rudzherovich correctly noted that this is probably more of a dream, but if there were no dreams, then, probably, there would be no planes, televisions, and so on, and we would not be sitting here, not communicating with you , Dear colleagues.
I’ll start, oddly enough, with the year 1867 and urge you to walk with me “back to the future.” Botkin Sergey Petrovich. It is no coincidence that I take our audience to the military medical academy, where Sergei Petrovich gave a lecture in 1867. He usually gave lectures in such a way that patients came, he demonstrated them and discussed with his listeners the main aspects of first the diagnosis and then the treatment. Here a young woman came with complaints of pain in the chest, in the left side, palpitations, shortness of breath and swelling of the neck, which prevented her from swallowing; often sweats both during the day and at night; urine is discharged in very copious quantities and frequently. I quote Sergei Petrovich: “Shaking in the legs and arms, especially when excited about something.” In general, we already, in principle, understand in which organ we should probably look for pathology.
Chest pain. It can be different. I will focus specifically on the pain that fascinated Sergei Petrovich more at that time. This young girl, as he says, “shows the place of pain under the left breast, where they usually begin, often spreading over the entire left side... The strength and duration vary... And they are most often caused by some kind of trouble or anxiety.”
You see a schematic history of the disease. It all starts in 1861. I calculated this because Botkin gave us detailed instructions on how everything happened. And we see that it all began, as often happened at that time, with fever, diarrhea and delirium - it was, apparently, typhus. Then the pain under the left breast began to increase. In 1866, her parents began to notice a swelling in the neck, and at the end an irregular rhythm appeared, this will also be clear in some aspects.
Inspection. “The patient is of good build, but pale. And at first glance you don’t notice any peculiarity in her face...except perhaps that the expression on her face is somewhat restless, as if she was frightened by something. And after that you begin to notice that her eyes are somewhat bulging. Then the increased volume of the neck due to the development of the thyroid gland sharply catches the eye...”
Percussion and palpation. Propaedeutics itself begins. It must be said that Sergei Petrovich, starting to percuss, percusses everything: the lungs, heart, liver, spleen, and so on. I will only dwell on the abnormalities that Sergei Petrovich identified. And these abnormalities lie mainly in the second intercostal space to the left of the sternum. Here the arrow shows that it occurs with a sharp dullness of tone along the parasternal left line in the region of the second rib and above.
Auscultation. In the same area, the second intercostal space to the left of the sternum “... listening to breathing, I find that it everywhere retains the vesicular character, but on the left side it is weaker, which is especially pronounced in the area of dull tone along the left parasternal line.” Dear colleagues, let’s briefly summarize. This means that in the second intercostal space to the left of the sternum there is a dullness of percussion sound, weakening of vesicular breathing and small, as he said, subcrepitating rales.
Please note that he also auscultates the thyroid gland. And I want to say right away that those symptoms of hyperthyroidism that we now know as Ringel’s symptom, as Moebius’ symptom, as Geoffroy’s symptom - all this is described by Botkin in this lecture, without calling it by its proper name. By the way, this later received the name Butman’s symptom, when we can hear a sharp arterial noise during auscultation of the thyroid gland.
Diagnosis. The diagnosis is beyond doubt. He says that you see a subject with a highly developed goiter, a certain degree of protrusion of the eyes, which, moreover, changes in size before your eyes, a frequent and uneven pulse, undulation of the neck veins, frequent and intermittent breathing. And just from this alone you can assume that you are dealing with Graves' or Graves' disease.
But the question arises: in which part of the heart should we look for the cause of pulmonary circulation disorder? We remember that the patient is choking, and this is basically what brought her to the doctor. What did Botkin find with his not very thin finger? So there was an airless state of the lung tissue, that is, atelectasis. That is, with the help of his hands and ears, Botkin in 1867 found compression of the lung tissue by the left atrium. And he says that this is where we need to look for the cause of shortness of breath. Moreover, he says that “enlargement of the right ventricle, which occurs more often than the left in patients, as he says with hyperthyroidism, is still a variable phenomenon, and the volume of the left atrium increases, I repeat, without fail. And you see on it, in addition, fluctuations in size (that is, one day one way, another day another) coinciding with the deterioration and improvement of the subjective state of the patients, which thus goes along with this increase or decrease in the size of the dull sound.” .
What was it? A forgotten disease? I'm not talking about hyperthyroidism now. I now want to turn my attention to the atrium. In these same clinical lectures, he says that “the weakness of the atrium alone is enough for blood to stagnate in it, as well as in the veins flowing into it, which thus expand, their valves become insufficient, and conditions are provided for the appearance of this undulation , which we observe in various forms of weakened cardiac activity and insufficiently rapid emptying of the atria.”
This year, as I already mentioned, we are celebrating the 180th anniversary of the birth of Sergei Petrovich Botkin. And when you read Botkin, you understand how modern he is, how far, on the one hand, we have come, and on the other hand, we have not gone very far in the diagnosis of some diseases.
So, atrial disease, has it been forgotten? No, and many scientists are working on this problem. There are different definitions, one of them is presented on the slide and belongs to Academician Ivashkin: Atrial disease is a primary or secondary pathology of the atria, which manifests itself with atriomegaly, various rhythm and conduction disorders, and symptoms of circulatory failure.
And the same risk factors for the presence of atriomegaly. We can also divide them into correctable and non-correctable. Of course, we are interested in correctable diseases, and today I will mostly talk about arterial hypertension. In general, we have just seen that arterial hypertension and chronic heart failure are practically the main cause of atrial fibrillation, heart rhythm disturbances. And I was always tormented by the question: after all, arterial hypertension is a condition when the left ventricle hypertrophies. Why do supraventricular arrhythmias occur more often than ventricular arrhythmias? I still can't figure out why, but this pattern probably has some answers. Because the atria are the weak link. And when there is an increase in pressure in the atria along the pressure gradient, since the left ventricle is thick or hypertrophied, it also increases the pressure within itself, then the atrium cannot hypertrophy for a long time, it dilates - and, please, atrial fibrillation. Therefore, fibrosis in the atria, atriomegaly - and hence the disruption of the electrical impulse, when fibrillation already generates fibrillation. This, in fact, seems to me to be what characterizes this patient.
And so we talk about fibrosis again. We, on the other hand, seem to approach fibrosis from a clinical perspective. And again, there are many definitions, but I, for example, like simple definitions that you don’t have to think about for a long time and can be remembered well and easily: this is the predominance of collagen synthesis over its breakdown. We are, of course, talking about structural collagen, the collagen that then forms a three-helical structure, which is very strong. And it is clear that once it has already formed, it is very difficult to reverse it or increase degradation.
Various types of fibrosis. Here are two portraits of the patient. Red – cardiomyocyte, gray – fibrosis. It is clear that the subject of our interest, of course, is the top picture, where there is reactive fibrosis - this is exactly the same hypertensive patient who seemed to be treated correctly. He didn't die from a heart attack or stroke, it didn't happen. But what happened to him? He developed left ventricular hypertrophy, which we consider to be an almost integral feature of arterial hypertension. But, in principle, it is probably necessary to intervene a little earlier - when even this reactive fibrosis has not yet appeared.
So I want to postulate that I think fibrosis is one of the earliest manifestations of atrial disease. And so the question arises: how to evaluate, how to prevent, is this even possible, and when to start treatment and what kind?
Please note, dear colleagues, in this picture we also see a cardiomyocyte, such a ubiquitous cytokine - transforming growth factor b-type - it is responsible for the initiation of fibrosis processes, the formation of collagen and other proteins of the intercellular matrix.
Let's look at what activates this cytokine - angiotensin-II, which is well known to us, and on the other hand, mechanical stretching. That is, any large chamber, ventricle or atrium, will itself cause its TGF-beta activity to increase. It will lead to the fact that cardiomyocytes are replaced, as if genotypically transformed into fibroblasts, and collagen is formed, and then fibrosis is formed.
We are extremely interested in this point, and I would like to briefly show the chronicle, facts and comments about atriomegaly. The first work aimed to substantiate the clinical consequences of atrial dilatation in diseases of the cardiovascular and bronchopulmonary systems. First, we realized that when the size of the left atrium is more than 4.7 cm, and the size of the right atrium is more than 4.8 cm, 100% of the clinical symptoms of chronic heart failure appear and persist: shortness of breath, cyanosis, fine rales in the lungs. That is, the presence of fine bubbling rales in the lungs clearly correlates with the size of the left atrium.
These, in my opinion, are very interesting, strange at first glance curves. But what do they characterize? The green curve depicts the percentage of patients with atriomegaly in whom the first tone is preserved. And we see that the larger the size of the left atrium, the fewer patients with preserved first sound. We always know that the first sound is a characteristic of the left ventricle, it is a systolic sound. And at the same time, the larger the size of the left atrium, the more patients with a weakened first sound. So, isn't this a manifestation of heart failure?
First step. Thus, the first step was a search, and we found that the “critical” dimensions of isolated dilatation of the left atrium, after which dilatation of the right atrium will necessarily join, are 4.2X4.4X4.7 cm.
Second step. Is it necessary to evaluate the contractile function of the atria, and why is it needed in general? It seemed to be as low as 25% or sometimes as low as 15% in left ventricular filling. And in principle, this is also a certain characteristic of diastolic heart failure. Please note, dear colleagues, this curve very much resembles the curve of the Frank-Starling law: the greater the maximum volume of the left atrium, the greater the volume of active emptying increases up to a certain point. But, as I already said, the “weak link” of the 4-chamber organ: it is quickly depleted, and with a large increase in the left atrium, the volume of activity decreases.
We are well aware of the assessment of the fibrosis fraction in the interventricular septum. The right picture shows how we circle it and calculate it using special methods. It is also possible to determine the size of fibrosis fractions, a little more, probably, this process will be labor-intensive, in the interatrial septum.
Wave R. If you look at P, then, of course, we are given a unique opportunity to assess the speed of electrical impulse transmission through the atria. These are traditional p-mitrale, p-pulmonale, but not only PQ as an interval, but also the PQ segment, of course, and the ratio give us a lot of information about what is happening with the atrium. In addition, to help the practitioner, it is very easy to calculate the volume of the left atrium using this formula: Left atrium end-systolic volume index (ml) = 8.0 + 0.2* (P wave duration in ms).
And absolutely amazing information in terms of the readiness of the atria to supraventricular rhythm disturbances is provided by the left atrial function index, which is calculated as the ratio of the emptying fraction to the integral of the linear velocity of the outflow tract of the left ventricle to the left atrium volume index.
In the same work, the speed of electrical impulse transmission through the atria was assessed. And also this interval, more than 165 ms, which is measured using an echocardiographic study, plus ECG sensors, says that this patient poses a risk in terms of atrial fibrillation.
Here's our data. The speckled gray is the volume of the left atrium, and the plain gray is the ejection fraction of the left atrium. Control – patients with paroxysmal atrial fibrillation (first two columns). It turned out that the greater the volume of the left atrium, the inevitably the left atrium ejection fraction will decrease. Why do this? Is this just a theory? In my opinion, no. And today, assessing the contractile function of the left atrium gives us the key to diagnosing atrial heart disease, identifying patients not just with atriomegaly, but with reduced contractile function. And, in my opinion, this is, of course, the search for new antiarrhythmics (and we practically only have two antiarrhythmics, and all with different side effects), and the search for something that is probably not the only thing we can and should use our usual antiarrhythmics.
Step three. Clinical and morphofunctional characteristics of atriomegaly in patients with chronic heart failure and impaired thyroid status. Please note, patients with CHF along with hyperthyroidism with hypothyroidism and the control group: in all patients the size of the left atrium is changed. Let's remember Botkin again, he said: “I always see a change in the size of the left atrium, which coincides with the deterioration and improvement of subjective states.” The hypothesis has been verified - it is so. But with the right atrium we did not find such differences in this work.
Step four. Biological markers of heart failure. And finally, once again about fibrosis. In patients with diastolic heart failure who met all the criteria, we looked at galectin-3, a soluble beta-galactoside binding protein. It is a family of lectins. It turned out that in patients with preserved ejection fraction, the level of galectin-3 release is 100% higher than in patients with reduced ejection fraction, which also, with a certain dose of assumption, suggests that fibrosis in such patients will be more pronounced.
Thus, we can postulate that fibrosis is the morphological basis of tachyarrhythmias. There are a lot of literary results here, here is an illustration taken from a magazine, a section of the pulmonary vein near its mouth. As a matter of fact, it is there that various manipulations are usually carried out in order to convert the praxial form of atrial fibrillation into sinus rhythm.
And again, angiotensin-II is to blame. This means that, in addition to conventional antiarrhythmics, agents that will reduce the activity of the renin-angiotensin-aldosterone system should be added to this therapy.
If we look at all the hormones and how they affect collagen synthesis, collagen degradation, and collagen accumulation, the worst character here is angiotensin II. It increases synthesis, it reduces degradation, and collagen accumulation is much greater. The second worst thing is aldosterone.
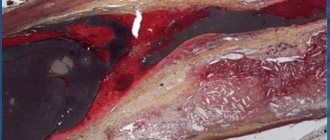
This is an example of a patient who suffered a myocardial infarction. Notice his heart, four weeks after myocardial infarction: yellow and red are the angiotensin-converting enzyme binding sites. Here we not only see in the area of myocardial infarction, as if from the side, but also EF - this means endocardial fibrosis. PF is pericardial fibrosis. There is a lot of fibrosis - there is a lot to act on, and the same with the AT receptor density, for example, after four weeks.
I exclaim again: we need a new approach! And we need to think about creating agents that selectively affect the atria. Are there such means? Here is their list so far. I will dwell on each of these medications every Internet session.
Today is the turn of ACE inhibitors. And indeed, Olga Nikolaevna showed this, ACE inhibitors both in the experiment, and not only in the experiment, demonstrated an effect on fibrosis. We see, for example, in six months the total Lisinopril is 9%. Over the year, Perindopril is 22%. And Losartan also showed its potential - 36% in a year.
It is with great pleasure that I want to present not only numerous foreign data, but also our work, the esteemed Professor Tatarsky from St. Petersburg. He looked at the paroxysmal form of atrial fibrillation, the addition of Lisinopril to standard therapy led to a decrease in the frequency of paroxysms, the duration of arrhythmia episodes, easier tolerability and transformation into an asymptomatic form.
In our practice, we most often use Lisinopril and Diroton. Diroton is not an original drug, it is also a generic, but nevertheless its potential, in general as an ACE inhibitor, in terms of fibrosis has not yet been revealed.
"Atrial cross". Molecular and cellular mechanisms.
We will deal with this “atrial cross”. We have only just gotten closer to it, but there is so much more that is written in small letters. I think this will all be extremely exciting and probably difficult. I encourage you to work with us.
Thank you very much for your attention.
Interventricular septal infarction
As mentioned above, isolated septal infarction is a rare occurrence (usually septal and anterior wall infarction). Septal infarction develops as a result of occlusion of the left anterior descending artery (LAD). The cardiogram records ST elevation in leads V1-V2.
Scheme 8. Infarction of the interventricular septum
ECG 2. Myocardial infarction of the interventricular septum
ECG source.
On ECG 2, an infarction of the interventricular septum is indicated by pathological Q waves in leads V1-V2 and moderate ST elevation in the same leads. Judging by the ST height and the presence of Q waves, this is a subacute stage of infarction. In addition, in this case there is diffuse ST segment depression in leads I, II, V4-V6 in combination with ST elevation in aVR. This indicates subendocardial myocardial ischemia.
Causes
The exact cause of disturbances in repolarization processes is unknown. Pathology can develop under the following conditions:
- Autonomic dysregulation syndrome – better known as vegetative-vascular dystonia;
- organic heart diseases - coronary disease, myocarditis, heart failure, cardiosclerosis, cardiomyopathies, thickening of the interventricular septum;
- the use of drugs that affect the excitability or metabolism of myocardial cells - antidepressants, adrenergic agonists, psychostimulants, cardiac glycosides;
- connective tissue dysplasia is a hereditary pathology characterized by insufficient production of collagen protein and manifested by joint hypermobility, increased skin extensibility, and impaired metabolic processes in the myocardium;
- changes in the blood levels of electrolytes - sodium, potassium, calcium, magnesium;
- Excessive physical activity – SIRD is common among athletes.
Anterior wall infarction
ST elevation infarction in the anterior wall region develops as a result of occlusion of the left anterior descending artery (LAD). The cardiogram records ST elevation in leads V3-V4. A reciprocal decrease in ST occurs in the inferior leads: III, aVF. Subsequently, pathological Q is formed in V3-V4.
Scheme 9. Infarction of the anterior wall
An infarction of the anterior wall, as a rule, is not isolated and is most often combined with an infarction of the interventricular septum and/or an infarction of the lateral wall of the left ventricle. This is determined by the fact that the interventricular septum and lateral wall are also supplied by the left anterior descending artery (LAD).
ECG 3. Infarction of the septum, anterior wall and partly the lateral wall of the left ventricle
ECG source.
On ECG 3, ST elevation in leads V1-V4, as well as deep Q waves in V1-V2, indicate infarction in the area of the interventricular septum (ST elevation in V1-V2) and the anterior wall of the left ventricle (ST elevation in V3-V4). There are tall coronary T waves in V2-V4. There is also slight ST elevation in leads I, aVL and V5, which may indicate extension of the infarction to the lateral wall of the left ventricle.
There is a reciprocal decrease in ST in lead III. These are signs of the acute phase of myocardial infarction with ST elevation.
ECG 4. Infarction of the anterior and lateral walls of the left ventricle
ECG source.
On ECG 4 there is ST elevation in leads V2-V6, I, aVL. Elevation in V3-V4 with maximum elevation in V3 indicates an infarction of the anterior wall, and ST elevation V5-V6, I, aVL indicates an infarction of the lateral wall of the left ventricle. In III and aVF there is reciprocal ST depression.
ECG 5. Extensive infarction of the interventricular septum, anterior and lateral walls of the left ventricle. “Tombstoning” pattern
ECG 5 shows massive ST segment elevation in leads V1-V6, I, aVL, reciprocal ST decrease in leads III and aVF. This morphological pattern on the cardiogram is called the “tombstoning” pattern and indicates occlusion of the proximal LAD. A prognostically unfavorable option with a high probability of damage to a large part of the myocardium with a sharp decrease in cardiac contractility and the development of cardiogenic shock.
Left ventricular lateral wall infarction
Left ventricular lateral wall infarction with ST elevation, as discussed above, is usually associated with anterior wall infarction. In addition, it can be combined with infarction of the lower or posterior wall. It develops as a result of occlusion of the left anterior descending artery (LAD) and/or the circumflex coronary artery (LCX).
Isolated lateral wall infarction is less common and is associated with occlusion of the small branches of the LAD or the marginal branch of the LCX.
Scheme 10. Infarction of the lateral wall of the left ventricle
On the cardiogram with a lateral wall infarction, ST elevation is recorded in leads I, aVL, V5-V6. If ST elevation is only in leads I, aVL, but not in leads V5-V6, they speak of a high lateral infarction. A reciprocal decrease occurs in leads III, aVF.
Examples of lateral wall infarction combined with anterior wall infarction were shown above (see ECG 3-5).
ECG 6. High lateral left ventricular infarction
ECG source.
ECG 6 shows ST elevation in leads I and aVL, as well as reciprocal depression in leads III, aVF. There is no ST elevation in leads V5-V6. These are signs of high lateral left ventricular infarction.
Infarction of the inferior wall
Inferior wall infarction with ST elevation in most cases (up to 80%) develops as a result of occlusion of the right coronary artery (RCA). In this case, the infarction of the lower wall can be isolated or combined with a right ventricular infarction.
Scheme 11. Infarction of the inferior wall
Less commonly, inferior wall infarction may be caused by occlusion of the left circumflex artery (LCX). This option can lead to the development of infarction of the lower and posterior wall, which has a worse prognosis due to the larger area of myocardial damage.
In rare cases, it is possible to develop a lower infarction with distal occlusion of the left anterior descending artery (LAD). This leads to a combination of infarction of the anterior and inferior walls.
In case of infarction of the lower wall, elevation of the ST segment and the subsequent formation of a pathological Q wave in leads II, III, aVF are recorded on the cardiogram. Reciprocal ST depression occurs in lead aVL and (not always) in lead I.
ECG 7. Inferior wall infarction with ST elevation
ECG source.
ECG 7 shows ST elevation and Q waves in leads II, III, aVF. At the same time, there is reciprocal ST depression in leads I and aVL. These changes indicate STEMI of the inferior wall of the left ventricle.
Posterior wall infarction
An infarction of the posterior wall, as a rule, develops in combination with an infarction of the lower or lateral wall of the left ventricle. Isolated posterior wall infarction occurs in no more than 10% of cases. However, isolated posterior wall infarction is not always recognized in a timely manner, since it develops infrequently and there is no ST segment elevation on a standard 12-lead cardiogram. To confirm this diagnosis, it is necessary to use additional posterior leads: V7-V9. Posterior wall infarction can be suspected from a 12-lead ECG based on the following signs:
- ST segment depression in leads V1-V3. This ST depression is reciprocal to ST elevation in the accessory posterior leads (V7-V9).
- Tall and usually widened R waves in leads V1-V3.
- The R/S ratio in V2 is greater than 1.
- Positive T wave in leads V1-V3.
ECG 8. Infarction of the posterior and inferior wall of the left ventricle with ST elevation
ECG source.
On ECG 8, ST segment depression, as well as a tall and wide R wave in leads V2-V3, indicate infarction in the posterior wall of the left ventricle. To confirm this diagnosis, a cardiogram was recorded using additional leads V7-V9, where ST elevation was recorded. In addition, in leads III, aVF, slight elevation of the ST segment was also recorded, which indicates involvement of the lower wall of the left ventricle in the process.
ECG 9. Infarction with ST elevation of the lateral and posterior wall of the left ventricle
ECG source.
On ECG 9, ST elevation in leads I, aVL, V5-V6 and reciprocal ST depression in leads III, aVF reflect infarction of the lateral wall of the left ventricle. In addition, there is a decrease in ST in leads V1-V3, which, in combination with high R waves in these same leads, may indicate posterior wall damage. Thus, in this case there is an infarction of the lateral and posterior wall of the left ventricle. To confirm posterior wall infarction, an ECG should be recorded in additional posterior leads (V7-V9).
Nonspecific abnormalities
These violations are recorded on the ECG. The diagnosis sounds like “moderate nonspecific changes in the myocardium.” They have a direct connection with repolarization processes. This pathological condition affects the process of recovery of myocytes after an impulse has passed through them.
As a rule, such disorders are not dangerous, and, if necessary measures are taken, are completely reversible, since they are provoked by various past diseases, hormonal imbalances, and impaired metabolic processes.
Complications can include angina, heart failure, and even myocardial infarction.
Changes in the left ventricular myocardium may not be dangerous to human health. Quite often they are diagnosed during routine examinations, that is, by accident. This means that there are almost no characteristic symptoms. But you should not underestimate this condition - if you do not take the necessary measures, the condition may worsen. Usually, with moderate changes, doctors recommend changing your diet, giving up bad habits, and improving your psycho-emotional state.