Electrocardiogram when the heart rotates around the longitudinal axis
When the heart rotates clockwise around its longitudinal axis (as viewed from the apex), the right ventricle moves forward and upward, and the left ventricle moves backward and downward.
This position is a variant of the vertical position of the heart axis. In this case, a deep Q wave appears on the ECG in lead III, and occasionally in lead aVF, which can simulate signs of focal changes in the posterior phrenic region of the left ventricle. At the same time, a pronounced S wave is detected in leads I and aVL (the so-called QIII SI syndrome). There is no q wave in leads I, V5 and V6. The transition zone may shift to the left. These changes also occur with acute and chronic enlargement of the right ventricle, which requires appropriate differential diagnosis.
The figure shows an ECG of a healthy 35-year-old woman with an asthenic build. There are no complaints about dysfunction of the heart and lungs. There is no history of diseases that could cause hypertrophy of the right heart. Physical and x-ray examination revealed no pathological changes in the heart and lungs.
The ECG shows the vertical position of the atrial and ventricular vectors. Â P = +75°. Â QRS = +80°. Noteworthy are the pronounced q waves along with tall R waves in leads II, III and aVF, as well as S waves in leads I and aVL. Transition zone in V4-V5. The indicated ECG features could provide grounds for determining hypertrophy of the right heart, but the absence of complaints, anamnesis data, and the results of clinical and X-ray examinations allowed us to exclude this assumption and consider the ECG to be a normal variant.
The rotation of the heart around the longitudinal axis counterclockwise (i.e., with the left ventricle forward and upward), as a rule, is combined with deviation of the apex to the left and is a rather rare variant of the horizontal position of the heart. This variant is characterized by a pronounced Q wave in leads I, aVL and left chest along with pronounced S waves in leads III and aVF. Deep Q waves may mimic signs of focal changes in the lateral or anterior wall of the left ventricle. The transition zone with this option is usually shifted to the right.
A typical example of this variant of the norm is the ECG shown in the figure of a 50-year-old patient with a diagnosis of chronic gastritis. This curve shows a pronounced Q wave in leads I and aVL and a deep S wave in lead III.
“Practical electrocardiography”, V.L. Doshchitsin
In some cases, variants of a normal ECG associated with different positions of the heart axis are mistakenly interpreted as a manifestation of one or another pathology. In this regard, we will first consider the “positional” variants of a normal ECG. As mentioned above, healthy people may have a normal, horizontal or vertical position of the electrical axis of the heart, which depends on body type, age and...
A normal ECG with a horizontal position of the electrical axis of the heart must be distinguished from signs of left ventricular hypertrophy. When the electrical axis of the heart is vertical, the R wave has a maximum amplitude in leads aVF, II and III; in leads aVL and I, a pronounced S wave is recorded, which is also possible in the left chest leads. ÂQRS = + 70° – +90°. Such...
Posterior rotation of the heart is accompanied by the appearance of a deep S1 wave in leads I, II and III, as well as in lead aVF. A pronounced S wave may also be observed in all chest leads with a shift of the transition zone to the left. This variant of a normal ECG requires differential diagnosis with one of the ECG variants for right ventricular hypertrophy (S-type). The picture shows...
Premature or early repolarization syndrome is a relatively rare variant of a normal ECG. The main symptom of this syndrome is ST segment elevation, which has a peculiar shape of a convex downward arc and begins from a high J point on the descending knee of the R wave or on the terminal part of the S wave. A notch at the point of transition of the QRS complex to the descending ST segment ...
Peculiar ECG changes are observed in individuals with dextrocardia. They are characterized by the opposite direction of the main teeth compared to the usual one. Thus, in lead I, negative P and T waves are detected, the main wave of the QRS complex is negative, and a QS type complex is often recorded. Deep Q waves may be observed in the chest leads, which may give rise to erroneous diagnosis of large-focal changes...
Source: www.medkursor.ru
Heart ruptures during a heart attack
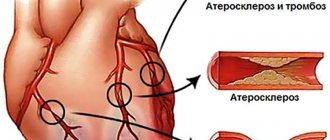
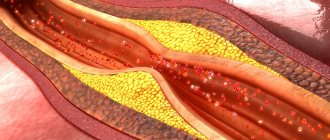
Cardiac rupture is a violation of the integrity of the walls of the heart, which most often occurs as a complication of acute myocardial infarction (death of a section of the heart muscle due to cessation of blood flow to it) and is accompanied by high mortality. In most patients, there is a rupture of the wall of the left ventricle, less often of the right ventricle, and even less often of the interventricular septum (the partition between the left and right ventricles of the heart) and the papillary muscles (the internal muscles of the heart that ensure the movement of the valves).
Possibility of heart rupture
Heart ruptures occur with myocardial infarction in 3% of cases, more often in the first week (50% of cases) of the first, usually anterior extensive transmural “Q-wave MI” and in elderly women. In the future, the risk of developing a rupture decreases as a post-infarction scar forms. Heart ruptures are the cause of mortality in 15% of cases and occupy 3rd place after ventricular fibrillation and coronary bypass surgery.
Heart ruptures usually occur in the interval from the first day of myocardial infarction to 3 weeks and have two peaks in the first 24 hours and on the 4th-7th day from the onset of myocardial infarction. The overwhelming majority of patients with cardiac ruptures die from hemopericardium within a few minutes.
Classification
By time:
- early (occur more often, in 80% of cases), peak - 3-5 days of myocardial infarction, when there is no scarring yet,
- late - due to thinning of the necrotic area,
By localization
- external,
- internal,
According to clinical development:
- slow flowing
- subacute (within several hours with clinical symptoms of increasing cardiac tamponade, when it is still possible to help the patient),
- acute, immediate (with acute hemotamponade).
External ruptures of the free wall of the left ventricle of the heart (occur in 2-10% of patients with myocardial infarction) with the leakage of blood from the left ventricle into the pericardial cavity (quickly filling it) and the development of cardiac tamponade, most often occur between the 1st and 21st days and occur in the area of extensive (more than 20% of the myocardial area) transmural myocardial infarction of the anterior wall or posterolateral segment of the left ventricle (especially in hypertensive patients) and in 10-20% of cases are responsible for hospital mortality from myocardial infarction. The left ventricle is susceptible to such ruptures 7 times more often than the right ventricle. Ruptures are common in older women (over 60 years of age) between the 1st day and 3 weeks of transmural myocardial infarction and in hypertensive patients.
Causes of heart ruptures
- Thinning of the wall of the left ventricle,
- Full-thickness myocardial wall necrosis (transmural infarction)
- Blood entering the ischemic zone (which weakens the myocardium);
- Unfavorable effect of thrombolytics on the organization of collagen and its synthesis in the infarct area;
- Resorption of collagen due to the influx of lymphocytes into the area of myocardial infarction;
- Poor development of collaterals;
- Inadequate myocardial modeling;
- Load on the myocardial wall in the “hard” zone of necrosis during systole and ruptures of myocardial microstructures;
- Persistent high blood pressure in the first days of myocardial infarction;
- Late hospitalization (12-24 hours);
- Persistent cough, vomiting or state of psychomotor agitation;
- Widespread myocardial infarction (more than 20% of myocardial area);
- Possible continuation of myocardial infarction (late ruptures).
Diagnostics
Analysis of the medical history and complaints, when chest pain appeared, weakness, what the patient associates with the appearance of these symptoms, whether there were chest injuries, whether the patient had previously noted attacks of chest pain, whether he has coronary heart disease), whether he had previously suffered a myocardial infarction.
Physical examination. Auscultation of the heart reveals characteristic murmurs. This noise is often accompanied by tremors in the pericardial region. When the papillary muscle is ruptured or torn off, severe valve insufficiency appears, accompanied by a systolic murmur over the entire region of the heart, especially over its apex.
Determination of troponin T or I in the blood helps to detect the presence of acute myocardial infarction.
An expanded coagulogram allows you to determine increased blood clotting, significant consumption of coagulation factors, and identify the appearance of breakdown products in the blood.
Electrocardiography (ECG). If the heart ruptures, the ECG continues to detect sinus rhythm or its replacement rhythm. Electromechanical dissociation is determined - a discrepancy between the presence of a heart rhythm on the ECG and the absence of normal blood flow (no pulse and blood pressure, or a weak pulse and low blood pressure). Over time, the normal rhythm slows down (becomes rare), gives way to single heartbeats and cardiac arrest develops.
Echocardiography (EchoCG). An echocardiographic study determines the location of the heart rupture, its size, assesses the accumulation of blood in the pericardial cavity (the pericardial sac), and detects changes in blood flow when the function of the heart valves is impaired (for example, when the papillary muscles are ruptured - the internal muscles of the heart that ensure the movement of the valves).
Treatment of heart rupture
Only surgical treatment gives a chance. The preoperative period is very short, only during the preparation of the operating room, since surgical treatment must be emergency. In the preoperative period, an attempt to stabilize hemodynamics is possible. For this use:
- intra-aortic balloon counterpulsation - implantation of a mechanical device to temporarily support the pumping function of the heart. This method allows you to reduce the load on the heart and increase blood supply to all organs, including the heart’s own arteries;
- intravenous drip administration of solutions from the nitrate group;
- pericardiocentesis - reduces cardiac tamponade with blood.
Surgical treatment involves open surgery, suturing the myocardial rupture with a patch and restoring its blood supply.
Complications and consequences
Every patient with a ruptured heart quickly dies in the absence of emergency surgical treatment. Even patients with a small heart rupture that closes on its own rarely survive more than 2 months without surgery.
Preventing heart rupture
Prevention of coronary heart disease:
- normalization of cholesterol levels in the blood: refusal to eat fatty foods; in the presence of elevated cholesterol levels, therapy with cholesterol-lowering drugs;
- to give up smoking;
- normalization of blood pressure (maintaining blood pressure within the range from 90/60 mm Hg to 140/90 mm Hg).
- Timely seeking medical help if a prolonged (more than 5 minutes) attack of chest pain occurs.
- Timely diagnosis and treatment of coronary heart disease ensures the prevention of myocardial infarction as the main cause of heart rupture.
- Early comprehensive treatment of existing myocardial infarction.
↑ Coriolis effect
In physics, the Coriolis effect
is the obvious deviation of moving objects when viewed from a rotating frame of reference. As an example, consider two children on opposite sides of a rotating carousel throwing a ball to each other (Figure 1). From these children's point of view, the ball's path is bent sideways by the Coriolis effect. From the thrower's perspective, this deflection is directed to the right as the carousel rotates counterclockwise (as viewed from above). Accordingly, when moving clockwise, the deflection is directed to the left.
If you are really interested in a detailed explanation of the Coriolis effect, enter “Coriolis effect” into a search engine and study this issue thoroughly.
Turn
Before starting to study new material, let's repeat that if each point of a plane is associated with some point of the same plane, and any point of the plane is associated with a certain point, then they say that a mapping of the plane onto itself is given.
Let us remember that the motion of a plane is a mapping of the plane onto itself, preserving distances.
We have already met and repeated some types of movement: such as axial symmetry, central symmetry, parallel translation.
Today in the lesson we will get acquainted with another type of mapping a plane onto itself - rotation.
Let's mark an arbitrary point O on the plane, call it the center of rotation, and set the angle α (let's call it the angle of rotation).
Rotation of the plane around point O by angle α is the mapping of the plane onto itself, in which each point M is mapped to a point M1 such that the angle MOM1=α. Note that point O remains in place, that is, in other words, it is mapped onto itself, and all other points rotate around point O, and if , then counterclockwise, if , then clockwise
Sometimes in the literature you can find the following notation for rotation around the center O and through the angle α: .
Now let's try to determine whether the turn will be a movement? To do this, it is enough to show that when turning, the distance between the points is maintained.
Let point O be the center of rotation, and angle α be the angle of rotation.
Let's consider the case when α>0, that is, we will rotate counterclockwise relative to point O. The case when α<0, that is, the case when we turn clockwise, is considered similarly; you can do this yourself.
Let, during this rotation, points M and N be mapped to points M1 and N1, respectively. Consider triangles OMN and OM1N1.
,
, in other words, when rotating, the distance between points is maintained. This means turning is another type of movement. It can be imagined as a rotation of the entire plane around a given point O by a given angle α.
Task.
Construct a segment that is obtained from a segment by rotating around a given center by:
a B C) .
Solution.
To rotate a segment, rotate the ends of this segment. In order to rotate point A, we construct a straight line OA. From point O, using a protractor, we mark 150° (we remember that if the angle is less than 0, then we turn it clockwise, that is, we will put the angle in this direction). Using a compass, we measure the distance AO and plot this distance on the resulting straight line.
Let's put point A1. Similarly, let's construct point B1. Then the resulting segment A1B1 is the required one. In order to perform a 100° turn, you need to move 100° counterclockwise.
All other constructions are carried out in the same way as we did in the first paragraph. When rotated by 180°, point A1 will lie on the continuation of straight line OA. Point B1 will lie on the continuation of straight line OB.
Task.
Construct a triangle that is obtained from this triangle by rotating around:
a) points on,
b) around a point not lying inside the triangle on,
c) around a point lying inside the triangle on .
Solution.
We will build a triangle by points. Since the center of rotation is point A, it maps onto itself. Let's display point B. From point A we'll set an angle equal to 80° counterclockwise. Let us plot a segment equal to side AB on this straight line and obtain point B1. Let's similarly construct point C1. Then triangle AB1C1 is the desired one.
Carrying out similar constructions, we will construct triangles A1B1C1 for the remaining two cases.
Today we are finishing our study of the topic Movement. Let's remember once again what movement is and what types of movement we have become familiar with.
The movement of a plane is a mapping of the plane onto itself, preserving distances.
We have proven that the movements are: axial symmetry, central symmetry, parallel translation and rotation.
↑ Direction of rotation of chakras
Peter Kalder did not describe the direction of movement of the vortices (chakras):
I wonder if Calder deliberately avoided mentioning the counterclockwise direction? According to Barbara Ann Brennan, a former NASA scientist and authority on human energy, healthy chakras should rotate clockwise; and closed, unbalanced ones are counterclockwise.
In her successful book, Hands of Light, she says:
When the chakras rotate counterclockwise, there is an outflow of energy from the body, causing metabolic disorders. In other words, when the chakra rotates counterclockwise, we do not receive the energy we need, which we perceive as psychological reality. Such a chakra is considered closed to incoming energy.”
↑ Possible influences of traditions
↑ (a) Traditional Tibetan “trul-hor” yantra yoga
Chogal Namhai Norbu
, one of the great masters of Dzogchen and Tantra, was born in Tibet in 1938.
His book Yantra Yoga: Tibetan Yoga of Movement
was published by Snow Lion Publishing House.
"Trul-hor" means "magic wheel"
, says Alejandro Chaul-Reich, a faculty member at the Ligmincha Institute and an assistant professor at the University of Texas Medical School. He says:
Ryan Parker
specialist in
the Five Tibetan Rituals
, currently conducting research comparing the Five Rituals and the Trul-Khor. According to Peter Kelder in The Eye of Revelation, the rituals, like the trul-khor, date back about 2,500 years.
In his latest Comparative Table he states:
↑ (b) Pradakshina
Throughout history, Tibet and India exchanged ancient knowledge, and it is possible - but not proven - that the First Ritual may have been influenced by the practice of Pradakshina.
In Hinduism Pradakshina
means the act of worship - walking clockwise around a holy place, temple, shrine. Dakshina means right, so you go to the left, with the spiritual object always on your right.
During Pradakshina, you walk clockwise around a temple, shrine, person, mountain, place or even yourself. Hindu temples even have special passages so that people can perform these movements around them in a clockwise direction.
The purpose of such circular movements is to focus or purify oneself, or to honor the object of worship.
Circling is so common that it is found in the cultures of the Greeks, Romans, Druids and Hindus. This is usually associated with a sacrifice or purification process. The interesting thing is that for all these cultures the direction of movement is always the same - clockwise!
What does turning the heart counterclockwise mean?
When the heart rotates clockwise around its longitudinal axis (as viewed from the apex), the right ventricle moves forward and upward, and the left ventricle moves backward and downward. This position is a variant of the vertical position of the heart axis. In this case, a deep Q wave appears on the ECG in lead III, and occasionally in lead aVF, which can simulate signs of focal changes in the posterior phrenic region of the left ventricle.
At the same time, a pronounced S wave is detected in leads I and aVL (the so-called QIII SI syndrome). There is no q wave in leads I, V5 and V6. The transition zone may shift to the left. These changes also occur with acute and chronic enlargement of the right ventricle, which requires appropriate differential diagnosis.
The figure shows an ECG of a healthy 35-year-old woman with an asthenic build. There are no complaints about dysfunction of the heart and lungs. There is no history of diseases that could cause hypertrophy of the right heart. Physical and x-ray examination revealed no pathological changes in the heart and lungs.
The ECG shows the vertical position of the atrial and ventricular vectors. Â P = +75°. Â QRS = +80°. Noteworthy are the pronounced q waves along with tall R waves in leads II, III and aVF, as well as S waves in leads I and aVL. Transition zone in V4-V5. The indicated ECG features could provide grounds for determining hypertrophy of the right heart, but the absence of complaints, anamnesis data, and the results of clinical and X-ray examinations allowed us to exclude this assumption and consider the ECG to be a normal variant.
The rotation of the heart around the longitudinal axis counterclockwise (i.e., with the left ventricle forward and upward), as a rule, is combined with deviation of the apex to the left and is a rather rare variant of the horizontal position of the heart. This variant is characterized by a pronounced Q wave in leads I, aVL and left chest along with pronounced S waves in leads III and aVF. Deep Q waves may mimic signs of focal changes in the lateral or anterior wall of the left ventricle. The transition zone with this option is usually shifted to the right.
A typical example of this variant of the norm is the ECG shown in the figure of a 50-year-old patient with a diagnosis of chronic gastritis. This curve shows a pronounced Q wave in leads I and aVL and a deep S wave in lead III.
“Practical electrocardiography”, V.L. Doshchitsin
Source: www.medkursor.ru
Hello! In order for my conclusion to be absolutely truthful, it is optimal, of course, to send the ECG picture itself. This way I have less to guess, and I can comment specifically on your ECG. Well, not everyone gets a good scan; many do not have ECG tapes on their hands at all, but only the text of the conclusions. Since, I see, many people read my explanations about the ECG, so I’ll say it for everyone. For me, as a specialist, it is important that you have and save ECG tapes. The texts of the conclusions may be lost, accidentally damaged, etc. If you happen to consult anywhere else regarding ECG findings, you will need tape everywhere. On the ECG, which is accompanied by a conclusion about the norm, another specialist may notice something that requires monitoring, explanation and even treatment. So, to your question. For a 16-year-old boy (this is how I determined the age of your son), a heart rate of 58 beats per minute will not be bradycardia, that is, a rare rhythm. He studies somewhere, plays sports or just plays football, sits at the computer, possibly a lot of time. Perhaps it is generally unacceptably high. Perhaps he doesn't sleep enough. Possibly underweight. That is, like the vast majority of modern teenagers, they become extremely tired, are not always tired of work, and do not have a strong reserve of physical strength. In this regard, the heart rate is low, it is correct to say so. Such an ECG conclusion as “early repolarization syndrome” (such a characteristic ECG picture) can speak of this too, although a direct examination of the teenager is very important here. The presence of this syndrome can sometimes be explained in terms of body structure: are you tall, thin, how developed is your muscle mass? The structure of the hand, the span of the arms, the flexibility of the body, the presence of heart murmurs and much, much more matter. Therefore, I cannot give a full answer regarding “early repolarization syndrome” without an examination. Well, as for the “predominance of activity of both ventricles,” it’s generally difficult to talk about this, both without seeing the ECG tape and without seeing the boy. Listening to the heart is important here. It is also necessary to know whether the teenager is involved in sports, or whether he is doing it uncontrollably? Unfortunately, very, very many teenagers do not have their first ECG until they are 16 years old. You must do it from the age of 10 until the age of 16, and do it repeatedly. There are corresponding orders for this, which are not carried out, like many other things. Let me summarize by saying that in this case, too, it is more than important to see the ECG tape when assessing the increased activity of the heart cords. Most likely, it will be correct if, based on the ECG results, your son is consulted by a pediatric cardiologist. It will probably be necessary to perform an echocardiography in your case. Good luck! Best regards, Yu.K.
Source: forum.chado.ru
Electrocardiography (ECG) remains one of the most common methods for examining the cardiovascular system and continues to develop and improve. Based on the standard electrocardiogram, various modifications of the ECG have been proposed and are widely used: Holter monitoring, high-resolution ECG, tests with dosed physical activity, drug tests [2, 5].
Leads in electrocardiography
The concept of “electrocardiogram lead” means recording an ECG when electrodes are applied to certain areas of the body that have different potentials. In practical work, in most cases, registration of 12 leads is limited: 6 from the limbs (3 standard and 3 “unipolar reinforced”) and 6 thoracic leads - unipolar. The classic lead method proposed by Einthoven is the registration of standard limb leads, designated by Roman numerals I, II, III [6].
Enhanced limb leads were proposed by Goldberg in 1942. They record the potential difference between one of the limbs on which the active positive electrode of a given lead is installed (right arm, left arm or left leg), and the average potential of the other two limbs. These leads are designated as follows: aVR, aVL, aVF. The designations for augmented limb leads come from the first letters of English words: a - augmented (reinforced), V - voltage (potential), R - right (right), L - left (left), F - foot (leg).
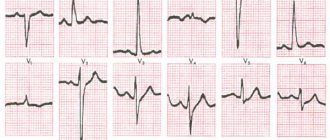
Unipolar chest leads are designated by the Latin letter V (potential, voltage) with the addition of the position number of the active positive electrode, indicated in Arabic numerals:
lead V1 is an active electrode located in the fourth intercostal space along the right edge of the sternum;
V2 - in the fourth intercostal space along the left edge of the sternum;
V3 - between V2 and V4;
V4 - in the fifth intercostal space along the left midclavicular line;
V5 - in the fifth intercostal space along the anterior axillary line;
V6 - in the fifth intercostal space in the midaxillary line.
Using the chest leads, you can judge the condition (size) of the heart chambers. If the usual program for recording 12 generally accepted leads does not allow one to reliably diagnose a particular electrocardiographic pathology or requires clarification of some quantitative parameters, additional leads are used. These could be leads
V7 - V9, right chest leads - V3R-V6R [6].
Electrocardiogram recording technique
The ECG is recorded in a special room, remote from possible sources of electrical interference. The study is carried out after a 15-minute rest on an empty stomach or no earlier than 2 hours after a meal. The patient should be undressed to the waist, the lower legs should be freed from clothing. Electrode paste must be used to ensure good skin contact with the electrodes. Poor contact or the appearance of muscle tremors in a cool room can distort the electrocardiogram. The examination, as a rule, is carried out in a horizontal position, although nowadays examinations have also begun to be carried out in a vertical position, since in this case a change in autonomic support leads to a change in some electrocardiographic parameters [7].
It is necessary to record at least 6-10 cardiac cycles, and in the presence of arrhythmia, much more - on a long tape.
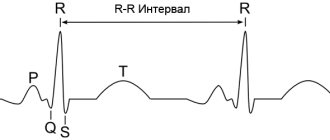
Normal electrocardiogram
On a normal ECG, 6 waves are distinguished, designated by the letters of the Latin alphabet: P, Q, R, S, T, U. The current electrocardiogram (Fig. 1) reflects the following processes: atrial systole (P wave), artioventricular conduction (PR interval or, as it was previously designated as the P-Q interval), ventricular systole (QRST complex) and diastole - the interval from the end of the T wave to the beginning of the P wave. All waves and intervals are characterized morphologically: the teeth - by height (amplitude), and the intervals - by time duration, expressed in milliseconds. All intervals are frequency-dependent quantities. The relationship between heart rate and the duration of one or another interval is given in the corresponding tables. All elements of a standard electrocardiogram have a clinical interpretation.
| Figure 1. Normal electrocardiogram |
Electrocardiogram analysis
The analysis of any ECG should begin with checking the correctness of its recording technique: to exclude the presence of various interferences that distort the ECG curve (muscle tremors, poor contact of electrodes with the skin), it is necessary to check the amplitude of the control millivolt (it should correspond to 10 mm). The distance between the vertical lines is 1 mm, which corresponds to 0.02 s when the belt moves at a speed of 50 mm/s, and 0.04 s at a speed of 25 mm/s. In pediatric practice, a speed of 50 mm/s is preferable, since against the background of physiological age-related tachycardia, errors are possible when calculating intervals at a tape speed of 25 mm/s.
In addition, it is advisable to take an ECG with a change in the patient’s position: in the wedge- and orthoposition, since in this case a change in the nature of autonomic support can contribute to a change in some parameters of the electrocardiogram - a change in the characteristics of the pacemaker, a change in the nature of the rhythm disturbance, a change in heart rate, a change in characteristics conductivity [2].
The general scheme of ECG analysis includes several components.
- Analysis of heart rate and conductivity: - determination of the source of excitation; - counting the number of heartbeats; — assessment of the regularity of heart contractions; — assessment of the conductivity function.
- Determination of rotations of the heart around the anteroposterior, longitudinal transverse axes: - the position of the electrical axis of the heart in the frontal plane (rotations around the anteroposterior, sagittal axis); — rotations of the heart around the longitudinal axis; - rotation of the heart around the transverse axis.
- Analysis of the atrial P wave.
- Analysis of the ventricular QRST complex: - analysis of the QRS complex; — analysis of the RS-T segment; - T wave analysis; - QT interval analysis.
- Electrocardiographic report.
Heart rate and conduction analysis
The source of excitation is determined by determining the polarity of the P wave and its position relative to the QRS complex. Sinus rhythm is characterized by the presence in standard lead II of positive P waves preceding each QRS complex. In the absence of these signs, a non-sinus rhythm is diagnosed: atrial, rhythm from the AV junction, ventricular rhythms (idioventricular), atrial fibrillation.
Counting the number of heartbeats is carried out using various methods. The most modern and simplest method is counting using a special ruler. If this is not available, you can use the following formula:
Heart rate = 60 RR,
where 60 is the number of seconds in a minute, RR is the duration of the interval, expressed in seconds.
If the rhythm is incorrect, you can limit yourself to determining the minimum and maximum heart rate, indicating this spread in the “Conclusion”.
Heart rate regularity is assessed by comparing the duration of RR intervals between successively recorded cardiac cycles. The RR interval is usually measured between the tips of the R (or S) waves. The spread of the obtained values should not exceed 10% of the average duration of the RR interval. It has been shown that sinus arrhythmia of varying severity is observed in 94% of children. Conventionally, V degrees of sinus arrhythmia severity are distinguished:
I degree - there is no sinus arrhythmia or fluctuations in heart rate per 1 minute do not exceed 5 contractions;
II degree - mild sinus arrhythmia, rhythm fluctuations within 6-10 contractions per minute;
III degree - moderately severe sinus arrhythmia, rhythm fluctuations within 11-20 contractions per 1 minute;
IV degree - pronounced sinus arrhythmia, rhythm fluctuations within 21-29 contractions per 1 minute;
V degree - pronounced sinus arrhythmia, rhythm fluctuations within 30 or more contractions per minute. Sinus arrhythmia is a phenomenon inherent in healthy children of all ages [7].
In addition to physiologically observed sinus arrhythmia, abnormal (irregular) heart rhythm can be observed with various types of arrhythmias: extrasystole, atrial fibrillation and others.
Assessment of conduction function requires measurement of the duration of the P wave, which characterizes the speed of conduction of the electrical impulse through the atria, the duration of the PQ (PR) interval (conduction speed through the atria, AV node and His system) and the total duration of the ventricular QRS complex (conduction of excitation through the ventricles). An increase in the duration of intervals and waves indicates a slowdown in conduction in the corresponding part of the conduction system of the heart.
The PQ interval (PR) corresponds to the time it takes for an impulse to travel from the sinus node to the ventricles and varies depending on age, gender and heart rate. It is measured from the beginning of the P wave to the beginning of the Q wave, and in the absence of a Q wave, to the beginning of the R wave. Normal fluctuations in the PR interval are between 0.11-0.18 s. In newborns, the PR interval is 0.08 s, in infants - 0.08-0.16 s, in older ones - 0.10-0.18 s. Slowing of atrioventricular conduction may be due to vagal influence [1, 2].
The PR interval may be shortened (less than 0.10 s) as a result of accelerated impulse conduction, innervation disorders, due to the presence of an additional fast conduction path between the atria and ventricles. Figure 3 shows one of the options for shortening the PR interval.
This electrocardiogram (see Fig. 2) reveals signs of the Wolff-Parkinson-White phenomenon, including: shortening of the PR interval to less than 0.10 s, the appearance of a delta wave on the ascending limb of the QRS complex, deviation of the electrical axis of the heart to the left. In addition, secondary ST-T changes may be observed. The clinical significance of the presented phenomenon lies in the possibility of the formation of supraventricular paroxysmal tachycardia by the re-entry mechanism (re-entry of the impulse), since additional conduction pathways have a shortened refractory period and are restored to conduct the impulse faster than the main pathway [8].
| Figure 2. ECG of child V. G., 14 years old. Diagnosis: Wolff-Parkinson-White phenomenon |
Determination of the position of the electrical axis of the heart
Rotations of the heart around the anteroposterior axis. It is customary to distinguish three conventional axes of the heart, as an organ located in three-dimensional space (in the chest).
The sagittal axis is anteroposterior, perpendicular to the frontal plane, passing from front to back through the center of mass of the heart. Turning counterclockwise along this axis brings the heart to a horizontal position (displacement of the electrical axis of the QRS complex to the left). Rotate clockwise to a vertical position (displacement of the QRS electrical axis to the right).
The longitudinal axis anatomically runs from the apex of the heart to the right venous opening. When rotated clockwise along this axis (viewed from the apex of the heart), most of the anterior surface of the heart is occupied by the right ventricle; when rotated counterclockwise, the left ventricle is occupied.
The transverse axis passes through the middle of the base of the ventricles perpendicular to the longitudinal axis. When rotating around this axis, a displacement of the heart is observed with the apex forward or the apex backward.
The main direction of the electromotive force of the heart is the electrical axis of the heart (EOS). Rotations of the heart around the conventional anteroposterior (sagittal) axis are accompanied by deviation of the EOS and a significant change in the configuration of the QRS complex in standard and enhanced unipolar limb leads.
Rotations of the heart around the transverse or longitudinal axes are referred to as so-called positional changes.
The determination of EOS is carried out using tables. To do this, compare the algebraic sum of the R and S waves in standard leads I and III.
There are the following options for the position of the electrical axis of the heart:
- normal position when the alpha angle is from +30° to +69°;
- vertical position - alpha angle from +70° to +90°;
- horizontal position - alpha angle from 0° to +29°;
- axis deviation to the right - alpha angle from +91° to +180°;
- axis deviation to the left - alpha angle from 0° to - 90°.
The nature of the location of the heart in the chest, and, accordingly, the main direction of its electrical axis, is largely determined by the characteristics of the physique. In children with asthenic physique, the heart is located vertically. In children with a hypersthenic constitution, as well as with a high position of the diaphragm (flatulence, ascites), it is horizontal, with a deviation of the apex to the left. More significant turns of the EOS around the anteroposterior axis, both to the right (more than +90°) and to the left (less than 0°), are usually caused by pathological changes in the heart muscle. A classic example of deviation of the electrical axis to the right is the situation with a ventricular septal defect or tetralogy of Fallot. An example of hemodynamic changes leading to deviation of the electrical axis of the heart to the left is aortic valve insufficiency.
An easier way to roughly determine the direction of the EOS is to find the limb lead in which the R wave is the highest (without an S wave or with a minimal S wave). If the maximum R wave in lead I is a horizontal position of the EOS, if in lead II it is normal, if in lead aVF it is vertical. Registration of the maximum R wave in lead aVL indicates a deviation of the EOS to the left, in lead III - a deviation of the EOS to the right, but if the maximum R wave is in lead aVR, the position of the EOS cannot be determined.
Atrial P wave analysis
P wave analysis includes: change in P wave amplitude; measurement of P wave duration; determination of P wave polarity; determination of the shape of the P wave.
The amplitude of the P wave is measured from the isoline to the top of the wave, and its duration is measured from the beginning to the end of the wave. Normally, the amplitude of the P wave does not exceed 2.5 mm, and its duration is 0.10 s.
Since the sinus node is located in the upper part of the right atrium between the mouths of the superior and inferior vena cava, the ascending part of the sinus node reflects the state of excitation of the right atrium, and the descending part reflects the state of excitation of the left atrium, and it is shown that the excitation of the right atrium occurs before the left by 0. 02-0.03 s. The normal P wave is rounded in shape, gently sloping, with symmetrical rise and fall (see Fig. 1). The cessation of atrial excitation (atrial repolarization) is not reflected on the electrocardiogram, as it merges with the QRS complex. In sinus rhythm, the direction of the P wave is positive.
In normosthenics, the P wave is positive in all leads except lead aVR, where all electrocardiogram waves are negative. The largest value of the P wave is in standard lead II. In individuals of asthenic physique, the size of the P wave increases in standard III and aVF leads, while in lead aVL the P wave may even become negative.
With a more horizontal position of the heart in the chest, for example in hypersthenics, the P wave increases in leads I and aVL and decreases in leads III and aVF, and in standard lead III the P wave may become negative.
Thus, in a healthy person, the P wave in leads I, II, aVF is always positive, in leads III, aVL it can be positive, biphasic or (rarely) negative, and in lead aVR it is always negative.
Ventricular QRST analysis
The QRST complex corresponds to the electrical systole of the ventricles and is calculated from the beginning of the Q wave to the end of the T wave.
Components of the electrical systole of the ventricles: the QRS complex itself, the ST segment, the T wave.
The width of the initial ventricular QRS complex characterizes the duration of excitation transmission through the ventricular myocardium. In children, the duration of the QRS complex ranges from 0.04 to 0.09 s, in infants - no wider than 0.07 s.
The Q wave is the negative wave before the first positive wave in the QRS complex. The Q wave can be positive only in one situation: congenital dextracardia, when it is facing upward in standard lead I. The Q wave is caused by the spread of excitation from the AV junction to the interventricular septum and papillary muscles. This most variable ECG wave may be absent in all standard leads. The Q wave must meet the following requirements: in leads I, aVL, V5, V6, not exceed 4 mm in depth, or 1/4 of its R, and also not exceed 0.03 s in duration. If the Q wave does not meet these requirements, it is necessary to exclude conditions caused by a deficiency of coronary blood flow [2]. In particular, in children, anomalous origin of the left coronary artery from the pulmonary artery (ALCA from PA or Bluntd-White-Garland syndrome) often appears as a congenital pathology of the coronary vessels [2,3]. With this pathology, the “coronary” Q wave is most often persistently detected in lead aVL (Fig. 3).
| Figure 3. ECG of child R. B., 4 years old. Diagnosis: anomalous origin of the left coronary artery from the pulmonary artery |
The presented electrocardiogram (see Fig. 3) reveals a deviation of the electrical axis of the heart to the left. In lead aVL, the Q wave is 9 mm, with a height of R = 15 mm, the duration of the Q wave is 0.04 s. At the same time, in standard lead I, the duration of the Q wave is also 0.04 s, in the same lead there are pronounced changes in the final part of the ventricular complex in the form of depression of the ST interval. The suspected diagnosis of anomalous origin of the left coronary artery from the pulmonary artery was confirmed by echocardiography and then by coronary angiography.
At the same time, in infants, a deep Q wave may be in lead III, aVF, and in lead aVR the entire ventricular complex may have a QS appearance.
The R wave consists of ascending and descending knees, is always directed upward (except in cases of congenital dextracardia), reflects the biopotentials of the free walls of the left and right ventricles and the apex of the heart. The ratio of the R and S waves and the change in the R wave in the chest leads are of great diagnostic importance. In healthy children, in some cases, different sizes of the R wave are observed in the same lead - electrical alternans.
The S wave, like the Q wave, is an unstable negative ECG wave. It reflects a somewhat late coverage of excitation of distant, basal areas of the myocardium, supraventricular crests, conus arteriosus, and subepicardial layers of the myocardium.
The T wave reflects the process of rapid repolarization of the ventricular myocardium, i.e., the process of restoration of the myocardium or cessation of excitation of the ventricular myocardium. The state of the T wave, along with the characteristics of the RS-T segment, is a marker of metabolic processes in the ventricular myocardium. In a healthy child, the T wave is positive in all leads except aVR and V1. In this case, in leads V5, V6, the T wave should be 1/3-1/4 of its R.
The RS-T segment—the segment from the end of the QRS (the end of the R or S wave) to the beginning of the T wave—corresponds to the period of full coverage of the ventricles by excitation. Normally, an upward or downward displacement of the RS-T segment is permissible in leads V1-V3 of no more than 2 mm [4]. In the leads most distant from the heart (in standard and unipolar leads from the limbs), the RS-T segment should be on the isoline, with a possible upward or downward displacement of no more than 0.5 mm. In the left chest leads, the RS-T segment is recorded on the isoline. The transition point of the QRS to the RS-T segment is designated as the RS-T junction point j (junction).
The T wave is followed by a horizontal T-P interval, corresponding to the period when the heart is at rest (diastole).
The U wave appears 0.01-0.04 s after the T wave, has the same polarity and ranges from 5 to 50% of the height of the T wave. To date, the clinical significance of the U wave has not been clearly defined.
QT interval. The duration of ventricular electrical systole has important clinical significance, since a pathological increase in ventricular electrical systole may be one of the markers of the appearance of life-threatening arrhythmias.
Electrocardiographic signs of hypertrophy and overload of the heart cavities
Cardiac hypertrophy is a compensatory adaptive reaction of the myocardium, expressed in an increase in the mass of the heart muscle [6]. Hypertrophy develops in response to increased stress in the presence of acquired or congenital heart defects or with increased pressure in the pulmonary or systemic circulation.
Electrocardiographic changes in this case are caused by: an increase in the electrical activity of the hypertrophied part of the heart; slowing down the conduction of an electrical impulse through it; ischemic, dystrophic and sclerotic changes in the altered heart muscle.
However, it should be noted that the term “hypertrophy” widely used in the literature does not always strictly reflect the morphological essence of the changes. Often, dilatation of the heart chambers has the same electrocardiographic signs as hypertrophy, with morphological verification of the changes.
When analyzing the ECG, the transition zone (Fig. 4) in the precordial leads should be taken into account.
| Figure 4. Condition of the main electrocardiogram waves in the chest leads. Transition zone |
The transition zone is determined by the lead in which the R and S waves, i.e., their amplitude on both sides of the isoelectric line, are equal (see Fig. 4). In healthy older children, the QRS transition zone is usually determined in leads V3, V4. When the ratio of vector forces changes, the transition zone moves towards their predominance. For example, with right ventricular hypertrophy, the transition zone moves to the position of the left precordial leads and vice versa.
Signs of atrial overload
Electrocardiographic signs of left atrium overload form an electrocardiographic complex of signs, called P-mitrale in the literature. Enlargement of the left atrium is a consequence of mitral regurgitation with congenital, acquired (due to rheumatic carditis or infective endocarditis), relative mitral regurgitation or mitral stenosis. Signs of left atrium overload are presented in Figure 5.
Enlargement of the left atrium (see Fig. 5) is characterized by:
- an increase in the total duration (width) of the P wave by more than 0.10 s;
- widened double-humped P wave in leads I, aVL, V5-V6;
- the presence of a pronounced negative phase of the P wave in lead V1 (more than 0.04 s in duration and more than 1 mm in depth).
| Figure 5. ECG of child K.I., 12 years old. Diagnosis: rheumatism, age-related rheumatic carditis, mitral valve insufficiency |
Since the lengthening of the P wave can be caused not only by an enlargement of the left atrium, but also by intra-atrial block, the presence of a pronounced negative phase of the P wave in lead V1 is more important when assessing overload (hypertrophy) of the left atrium. At the same time, the severity of the negative phase of the P wave in lead V1 depends on the heart rate and on the general characteristics of the wave voltage.
Electrocardiographic signs of overload (hypertrophy) of the right atrium form a complex of signs called P-pulmonale, since it develops in pulmonary pathology, as well as in chronic pulmonary heart disease. However, these conditions are uncommon in children. Therefore, the main causes of enlargement of the right atrium are congenital heart defects, such as Ebstein's tricuspid valve anomaly, as well as primary changes in the pulmonary artery - primary pulmonary hypertension.
| Figure 6. ECG of child V.S., 13 years old. Primary pulmonary hypertension |
Signs of right atrium enlargement are presented in Figure 6.
- Enlargement of the right atrium (see Fig. 6) is characterized by:
- a high-amplitude P wave with a pointed apex in leads II, III, aVF, this sign is required in lead V1 or V2;
- with a P wave duration not exceeding 0.10 s.
In Figure 6, in addition to signs of right atrium overload, there are also signs of right ventricular overload.
Signs of ventricular overload (hypertrophy)
Since the ECG normally reflects the activity of only the left ventricle, electrocardiographic signs of left ventricular overload emphasize (exaggerate) the norm. Where the R wave is normally high (in lead V4, the position of which coincides with the left border of the heart), it becomes even higher; where the S wave is normally deep (in lead V2), it becomes even deeper.
Many voltage criteria for overload (hypertrophy) of the left ventricle have been proposed - more than 30. The most well-known include the Sokolov-Lyon index: the sum of the amplitudes of the R wave in lead V5 or V6 (where there is more) and S in lead V1 or V2 (where there is more ) more than 35 mm. However, the amplitude of the waves in the precordial leads is influenced by the gender, age and constitution of the patient. Thus, an increase in the voltage of the teeth can be observed in thin young people. Therefore, secondary changes in the final part of the ventricular complex are of great importance: displacement of the ST interval and T wave. As a sign of a relative deficiency of coronary blood flow, deepening of the Q wave in leads V5, V6 is possible. But at the same time, the Q wave should not exceed more than 1/4 of its R and 4 mm in depth, since this sign indicates a primary coronary pathology [2].
Predominant dilatation of the left ventricle has the following characteristics: R in V6 is greater than R in V5, greater than R in V4 and greater than 25 mm; sudden transition from deep S waves to high R waves in the precordial leads; shift of the transition zone to the left (towards V4) (Fig. 7).
| Figure 7. ECG of child G. Sh., 3 years old. Diagnosis: congenital mitral valve insufficiency |
Signs of predominant hypertrophy of the left ventricular myocardium are depression (displacement below the isoline) of the ST segment in lead V6, possibly also in V5 (Fig.  [4, 7].
| Figure 8. ECG of child G. Sh., 3 years old. Diagnosis: congenital mitral valve insufficiency |
Electrocardiographic signs of overload (hypertrophy) of the right ventricle appear when its mass increases by 2-3 times. The most reliable sign of right ventricular hypertrophy is the qR complex in lead V1.
Additional signs are secondary changes in the form of ST segment displacement and changes in the T wave. In some pathological conditions, in particular with an atrial septal defect, right ventricular hypertrophy is also demonstrated by incomplete right bundle branch block in the form of rsR in lead V1 (Fig. 9) [ 7].
| Figure 9. ECG of child M.K., 8 years old. Diagnosis: atrial septal defect |
In conclusion, a standard electrocardiogram is very important for an adequate diagnosis, subject to several rules. This is, firstly, taking an electrocardiogram with a change in body position, which makes it possible to initially differentiate organic and inorganic damage to the heart. Secondly, this is the choice of the optimal shooting speed - for children 50 mm/s. Finally, the electrocardiogram should be analyzed taking into account the individual characteristics of the child, including his constitution.
For questions regarding literature, please contact the editor.
The editors apologize for typos
In the output of the article “Foot and Mouth Disease”, No. 8 2004, you should read:
A. E. Kudryavtsev, Candidate of Medical Sciences, Associate Professor, T. E. Lisukova, Candidate of Medical Sciences, Associate Professor, G. K. Alikeeva, Candidate of Medical Sciences Central Research Institute of Epidemiology, Ministry of Health of the Russian Federation, Moscow
In the article by I. Yu. Fofanova “Some issues of the pathogenesis of intrauterine infections”, No. 10.2004. On page 33 in the 2nd column from left to right it should be read: “In the second trimester (after clarification of the diagnosis), the use of antibacterial therapy is indicated, taking into account the sensitivity of antibiotics (penicillin or macrolides). Prescription of amoxiclav, augmentin, ranklav, azitrox, sumamed during pregnancy is possible only when the expected benefit to the mother outweighs the potential risk to the fetus or child. Despite the fact that experimental studies have not revealed the teratogenic effects of these drugs, their use during pregnancy should be avoided.”
E. V. Murashko, Candidate of Medical Sciences, Associate Professor of Russian State Medical University, Moscow
Source: www.lvrach.ru
About the heart:
↑ Other interesting information about clockwise rotation
During one of my classes, a dance teacher told me that children are initially taught to spin in a clockwise direction. Obviously, it's easier for them (although there are exceptions). He said it was well known among dance teachers - if you want to calm children down, make them spin counter-clockwise
.
And to activate them, let them spin clockwise!
This energetic effect is exactly what people experience when performing Ritual No. 1, as described by Colonel Bradford. It seems to me that if the lamas gave instructions to rotate clockwise, then this is how it should be!
↑ Who practices counterclockwise rotation
However, I am familiar with a certain Marina who rotates counterclockwise due to a life-threatening health condition that she is trying to correct. She is very committed to meeting her body's needs, as you can read below:
To summarize, until documents or teachers are found, all attempts to understand the motives of Ritual No. 1 will only be theoretical. Therefore, you should do what you personally feel is good for you!
Source: 5rites.ru