31
Author of the article: Marina Dmitrievna
2017.07.23
33 896
Diagnostics
Cardiovascular diseases are the most common cause of death in post-industrial society. Timely diagnosis and treatment of the cardiovascular system helps reduce the risk of developing heart pathologies among the population.
An electrocardiogram (ECG) is one of the simplest and most informative methods for studying cardiac activity. An ECG records the electrical activity of the heart muscle and displays the information in the form of waves on a paper tape.
ECG results are used in cardiology to diagnose various diseases. It is not recommended to decipher the ECG of the heart on your own; it is better to consult a specialist. However, to get a general idea, it is worth knowing what the cardiogram shows.
Indications for an ECG
In clinical practice, there are several indications for electrocardiography:
- severe chest pain;
- constant fainting;
- dyspnea;
- exercise intolerance;
- dizziness;
- heart murmurs.
During a routine examination, an ECG is a mandatory diagnostic method. There may be other indications determined by the attending physician. If you experience any other alarming symptoms, consult your doctor immediately to determine their cause.
How to decipher a cardiogram of the heart?
A strict plan for deciphering an ECG consists of analyzing the resulting graph. In practice, only the total vector of the QRS complex is used. The work of the heart muscle is presented in the form of a continuous line with marks and alphanumeric designations. Any person can decipher an ECG with certain training, but only a doctor can make the correct diagnosis. ECG analysis requires knowledge of algebra, geometry and an understanding of letter symbols.
Not only cardiologists, but also general practitioners (for example, paramedics) have to read ECGs and make conclusions. Timely interpretation of the ECG makes it possible to provide effective first aid to victims.
ECG indicators that need to be taken into account when interpreting the results:
- intervals;
- segments;
- teeth.
There are strict indicators of normality on the ECG, and any deviation is already a sign of disturbances in the functioning of the heart muscle. Pathology can only be excluded by a qualified specialist - a cardiologist.
ECG interpretation in adults - the norm in the table
Myocardial hypertrophy
With chronic overload (pressure, volume), the heart muscle in certain areas begins to thicken, and the chambers of the heart begin to stretch. On the ECG, such changes are usually described as hypertrophy.
- Left ventricular hypertrophy (LVH) is typical for arterial hypertension, cardiomyopathy, and a number of heart defects. But even normally, athletes, obese patients and people engaged in heavy physical labor may experience signs of LVH.
- Right ventricular hypertrophy is an undoubted sign of increased pressure in the pulmonary blood flow system. Chronic cor pulmonale, obstructive pulmonary diseases, cardiac defects (pulmonary stenosis, tetralogy of Fallot, ventricular septal defect) lead to RVH.
- Left atrial hypertrophy (LAH) – with mitral and aortic stenosis or insufficiency, hypertension, cardiomyopathy, after myocarditis.
- Right atrial hypertrophy (RAH) – with cor pulmonale, tricuspid valve defects, chest deformities, pulmonary pathologies and PE.
- Indirect signs of ventricular hypertrophy are deviation of the electrical axis of the heart (EOC) to the right or left. The left type of EOS is its deviation to the left, that is, LVH, the right type is RVH.
- Systolic overload is also evidence of hypertrophy of the heart. Less commonly, this is evidence of ischemia (in the presence of angina pain).
Cardiogram analysis
The ECG records cardiac activity in twelve leads: 6 limb leads (aVR, aVL, aVF, I, II, III) and six chest leads (V1-V6). The P wave reflects the process of excitation and relaxation of the atria. The Q, S waves show the depolarization phase of the interventricular septum. R - wave, indicating depolarization of the lower chambers of the heart, and T-wave - relaxation of the myocardium.
Electrocardiogram analysis
The QRS complex shows the time of ventricular depolarization. The time it takes for an electrical impulse to travel from the SA node to the AV node is measured by the PR interval.
Computers built into most ECG devices are capable of measuring the time it takes for an electrical impulse to travel from the SA node to the ventricles. These measurements can help your doctor evaluate your heart rate and certain types of heart block.
Computer programs can also interpret ECG results. And as artificial intelligence and programming improve, they are often more accurate. However, ECG interpretation has many subtleties, so human factors still remain an important part of the assessment.
There may be abnormalities in the electrocardiogram that do not affect the patient’s quality of life. However, there are standards for normal cardiac performance that are accepted by the international cardiological community.
Based on these standards, a normal electrocardiogram in a healthy person looks like this:
- RR interval – 0.6-1.2 seconds;
- P-wave – 80 milliseconds;
- PR interval – 120-200 milliseconds;
- PR segment – 50-120 milliseconds;
- QRS complex – 80-100 milliseconds;
- J-wave: absent;
- ST segment – 80-120 milliseconds;
- T-wave – 160 milliseconds;
- ST interval – 320 milliseconds;
- The QT interval is 420 milliseconds or less if the heart rate is sixty beats per minute.
- ind.juice – 17.3.
Normal ECG
Pathological ECG parameters
The ECG in normal and pathological conditions is significantly different. Therefore, it is necessary to carefully approach the decoding of the heart cardiogram.
QRS complex
Any abnormality in the electrical system of the heart causes a prolongation of the QRS complex. The ventricles have greater muscle mass than the atria, so the QRS complex is significantly longer than the P wave. The duration, amplitude, and morphology of the QRS complex are useful in identifying cardiac arrhythmias, conduction abnormalities, ventricular hypertrophy, myocardial infarction, electrolyte abnormalities, and other disease conditions.
Q, R, T, P, U teeth
Abnormal Q waves occur when an electrical signal passes through damaged heart muscle. They are considered markers of previous myocardial infarction.
R-wave depression is also usually associated with myocardial infarction, but it can also be caused by left bundle branch block, WPW syndrome, or hypertrophy of the lower chambers of the heart muscle.
Table of ECG indicators is normal
T wave inversion is always considered an abnormal value on the ECG tape. Such a wave may be a sign of coronary ischemia, Wellens' syndrome, hypertrophy of the lower cardiac chambers, or a central nervous system disorder.
A P wave with increased amplitude may indicate hypokalemia and right atrial hypertrophy. Conversely, a P wave with reduced amplitude may indicate hyperkalemia.
U waves are most often observed with hypokalemia, but may also be present with hypercalcemia, thyrotoxicosis, or taking epinephrine, class 1A and 3 antiarrhythmic drugs. They are often found in congenital long QT syndrome and intracranial hemorrhage.
An inverted U wave may indicate pathological changes in the myocardium. Another U-wave can sometimes be seen on ECGs in athletes.
QT, ST, PR intervals
QTc prolongation causes premature action potentials during late phases of depolarization. This increases the risk of developing ventricular arrhythmias or fatal ventricular fibrillation. Higher rates of QTc prolongation are observed in women, older patients, hypertensive patients, and short people.
The most common causes of QT prolongation are hypertension and certain medications. The duration of the interval is calculated using the Bazett formula. With this symptom, the interpretation of the electrocardiogram should be performed taking into account the medical history. This measure is necessary to eliminate hereditary influence.
ST interval depression may indicate coronary ischemia, transmural myocardial infarction, or hypokalemia.
Characteristics of all indicators of electrocardiographic research
A prolonged PR interval (greater than 200 ms) may indicate first-degree heart block. Prolongation may be associated with hypokalemia, acute rheumatic fever, or Lyme disease. A short PR interval (less than 120 ms) may be associated with Wolff-Parkinson-White syndrome or Lown-Ganong-Levine syndrome. PR segment depression may indicate atrial injury or pericarditis.
Conduction disorders
Normally, having formed in the sinus node, electrical excitation travels through the conduction system, experiencing a physiological delay of a split second in the atrioventricular node. On its way, the impulse stimulates the atria and ventricles, which pump blood, to contract. If in any part of the conduction system the impulse is delayed longer than the prescribed time, then excitation to the underlying sections will come later, and, therefore, the normal pumping work of the heart muscle will be disrupted. Conduction disturbances are called blockades. They can occur as functional disorders, but more often they are the result of drug or alcohol intoxication and organic heart disease. Depending on the level at which they arise, several types are distinguished.
Sinoatrial blockade
When the exit of an impulse from the sinus node is difficult. In essence, this leads to sick sinus syndrome, slowing of contractions to severe bradycardia, impaired blood supply to the periphery, shortness of breath, weakness, dizziness and loss of consciousness. The second degree of this blockade is called Samoilov-Wenckebach syndrome.
Atrioventricular block (AV block)
This is a delay of excitation in the atrioventricular node longer than the prescribed 0.09 seconds. There are three degrees of this type of blockade. The higher the degree, the less often the ventricles contract, the more severe the circulatory disorders.
- In the first, the delay allows each atrial contraction to maintain an adequate number of ventricular contractions.
- The second degree leaves some of the atrial contractions without ventricular contractions. It is described, depending on the prolongation of the PQ interval and the loss of ventricular complexes, as Mobitz 1, 2 or 3.
- The third degree is also called complete transverse blockade. The atria and ventricles begin to contract without interconnection.
In this case, the ventricles do not stop because they obey the pacemakers from the underlying parts of the heart. If the first degree of blockade may not manifest itself in any way and can be detected only with an ECG, then the second is already characterized by sensations of periodic cardiac arrest, weakness, and fatigue. With complete blockades, brain symptoms are added to the manifestations (dizziness, spots in the eyes). Morgagni-Adams-Stokes attacks may develop (when the ventricles escape from all pacemakers) with loss of consciousness and even convulsions.
Impaired conduction within the ventricles
In the ventricles, the electrical signal propagates to the muscle cells through such elements of the conduction system as the trunk of the His bundle, its legs (left and right) and branches of the legs. Blockades can occur at any of these levels, which is also reflected in the ECG. In this case, instead of being simultaneously covered by excitation, one of the ventricles is delayed, since the signal to it bypasses the blocked area.
In addition to the place of origin, a distinction is made between complete or incomplete blockade, as well as permanent and non-permanent blockade. The causes of intraventricular blocks are similar to other conduction disorders (ischemic heart disease, myocarditis and endocarditis, cardiomyopathies, heart defects, arterial hypertension, fibrosis, heart tumors). Also affected are the use of antiarthmic drugs, an increase in potassium in the blood plasma, acidosis, and oxygen starvation.
- The most common is blockade of the anterosuperior branch of the left bundle branch (ALBBB).
- In second place is right leg block (RBBB). This blockade is usually not accompanied by heart disease.
- Left bundle branch block is more typical for myocardial lesions. In this case, complete blockade (PBBB) is worse than incomplete blockade (LBBB). It sometimes has to be distinguished from WPW syndrome.
- Blockade of the posteroinferior branch of the left bundle branch can occur in individuals with a narrow and elongated or deformed chest. Among pathological conditions, it is more typical for overload of the right ventricle (with pulmonary embolism or heart defects).
The clinical picture of blockades at the levels of the His bundle is not expressed. The picture of the underlying cardiac pathology comes first.
- Bailey's syndrome is a two-bundle block (of the right bundle branch and the posterior branch of the left bundle branch).
Examples of heart rate descriptions and ECG interpretation
Normal sinus rhythm
Sinus rhythm is any heart rhythm in which the excitation of the heart muscle begins from the sinus node. It is characterized by correctly oriented P waves on the ECG. By convention, the term "normal sinus rhythm" includes not only normal P waves, but also all other ECG measurements.
ECG norm and interpretation of all indicators
ECG norm in adults:
- heart rate from 55 to 90 beats per minute;
- regular rhythm;
- normal PR interval, QT and QRS complex;
- The QRS complex is positive in almost all leads (I, II, AVF and V3-V6) and negative in aVR.
Sinus bradycardia
A heart rate less than 55 in sinus rhythm is called bradycardia. ECG interpretation in adults should take into account all parameters: sports, smoking, medical history. Because in some cases, bradycardia is a variant of the norm, especially in athletes.
Pathological bradycardia occurs with weak sinus node syndrome and is recorded on the ECG at any time of the day. This condition is accompanied by constant fainting, pallor and hyperhidrosis. In extreme cases, pacemakers are prescribed for malignant bradycardia.
Sinus bradycardia
Signs of pathological bradycardia:
- heart rate less than 55 beats per minute;
- sinus rhythm;
- P waves are vertical, consistent, and normal in morphology and duration;
- PR interval from 0.12 to 0.20 seconds;
- QRS complex less than 0.12 seconds.
Sinus tachycardia
A regular rhythm with a high heart rate (above 100 beats per minute) is commonly called sinus tachycardia. Note that normal heart rate varies depending on age; for example, in infants, the heart rate may reach 150 beats per minute, which is considered normal.
Advice! At home, severe coughing or pressing on the eyeballs can help with severe tachycardia. These actions stimulate the vagus nerve, which activates the parasympathetic nervous system, causing the heart to beat slower.
Sinus tachycardia
Signs of pathological tachycardia:
- Heart rate is above one hundred beats per minute;
- sinus rhythm;
- P waves are vertical, consistent and normal in morphology;
- PR interval fluctuates between 0.12-0.20 seconds and shortens with increasing heart rate;
- QRS complex less than 0.12 seconds.
Atrial fibrillation
Atrial fibrillation is an abnormal heart rhythm characterized by rapid and irregular contraction of the atria. Most episodes are asymptomatic. Sometimes an attack is accompanied by the following symptoms: tachycardia, fainting, dizziness, shortness of breath or chest pain. The disease is associated with an increased risk of heart failure, dementia and stroke.
Atrial fibrillation
Signs of atrial fibrillation:
- Heart rate is unchanged or accelerated;
- P waves are absent;
- electrical activity is chaotic;
- RR intervals are irregular;
- QRS complex less than 0.12 seconds (in rare cases, the QRS complex lengthens).
Important! Despite the above explanations with the decoding of the data, an ECG conclusion should only be made by a qualified specialist - a cardiologist or a general physician. Decoding the electrocardiogram and differential diagnosis requires higher medical education.
Numbers and Latin letters in ECG interpretation
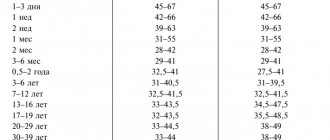
- When describing an ECG, the heart rate (HR) is usually indicated. The norm is from 60 to 90 (for adults), for children (see table)
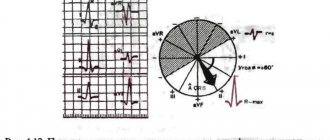
- The following are the various intervals and teeth with Latin designations. (ECG with interpretation, see Fig.)
PQ- (0.12-0.2 s) – atrioventricular conduction time. Most often it lengthens against the background of AV blockade. Shortened in CLC and WPW syndromes.
P – (0.1s) height 0.25-2.5 mm describes atrial contractions. May indicate their hypertrophy.
QRS – (0.06-0.1s) -ventricular complex
QT – (no more than 0.45 s) lengthens with oxygen starvation (myocardial ischemia, infarction) and the threat of rhythm disturbances.
RR - the distance between the apices of the ventricular complexes reflects the regularity of heart contractions and makes it possible to calculate heart rate.
The interpretation of the ECG in children is presented in Fig. 3
How to “read” myocardial infarction on an ECG?
Students starting to study cardiology often have a question: how to learn to read a cardiogram correctly and identify myocardial infarction (MI)? You can “read” a heart attack on a paper tape based on several signs:
- ST segment elevation;
- peaked T wave;
- deep Q wave or lack thereof.
When analyzing electrocardiography results, these indicators are first identified, and then the others are dealt with. Sometimes the earliest sign of acute myocardial infarction is only a peaked T wave. In practice, this is quite rare because it appears only 3-28 minutes after the onset of a heart attack.
Peaked T waves should be distinguished from peaked T waves associated with hyperkalemia. In the first few hours, the ST segments usually rise. Pathological Q waves may appear within a few hours or after 24 hours.
Long-term ECG changes such as persistent Q waves (93% of cases) and spiky T waves are common. Sustained ST segment elevation is rare except in ventricular aneurysms.
Indicators of myocardial infarction on ECG
There are widely researched clinical solutions, such as the TIMI score, that help predict and diagnose myocardial infarction based on clinical data. For example, TIMI scores are often used to predict the status of patients with symptoms of MI. Based on symptoms and electrocardiographic findings, practitioners can differentiate between unstable angina and MI in the emergency setting.