Insufficient oxygen supply to the heart muscle leads to circulatory failure and necrosis of an area in the myocardium - a heart attack. An ECG during myocardial infarction (MI) reveals disturbances in cardiac electrical conduction and abnormal changes that indicate this pathology.
If any part of the myocardium is not supplied with oxygen for 20 minutes, tissue necrosis develops. The number of dead cells increases depending on the size of the blocked artery. The main sign of a heart attack is unbearable pain in the chest, which cannot be relieved with medication.
What does a cardiogram show during a heart attack?
Electrocardiography (ECG) is a test performed first when a myocardial infarction is suspected. Based on the recorded cardiogram, several conclusions can be drawn:
1. The area of the dead zone located in the thickness of the heart muscle is indicated by a change in the QRS complex . Usually this part increases or a pathologically high Q wave .
2. About the place around the formed necrosis, which is affected by the displacement of the ST segment .
3. About the ischemic zone, which is located even further from the point of injury. An electrocardiogram records a violation of the myocardial restoration processes in the form of changes in the T wave .
The concept of ST segment elevation: above without atrial repolarization, below with atrial repolarization without QRS
During an ECG, each lead is recorded on the film with a new line, which helps to accurately determine the location of the cardiac lesion. In total, the electrocardiogram consists of 12 graphic lines and 5 teeth - P, Q, R, S, T. Each tooth is distinguished by its width, height, depth and goes in its own direction.
projection of ECG leads
projection of ECG leads
The dynamics of the development of a heart attack on the ECG become visible in the first minutes after the development of the disease. On the film, changes are displayed depending on the shape of the infarction, its location and stage of progression. They can be barely noticeable (with small focal lesions) or have a clear “classical” form, known to all literate people.
Signs of pathology on film
Electrocardiography today is the most important and accessible method for diagnosing myocardial infarction.
The study is done using an electrocardiograph - a device that transforms signals received from a beating heart and turns them into a curved line on film. The recording is deciphered by the doctor, forming a preliminary conclusion. General diagnostic ECG criteria for myocardial infarction include:
- Absence of the R wave in those leads where the infarction area is located.
- The appearance of a pathological Q wave. It is considered such when its height is more than one-fourth of the amplitude R, and its width is more than 0.03 seconds.
- ST segment elevation above the area of cardiac muscle damage.
- ST shift below the isoline in leads opposite to the pathological area (discordant changes). Drawing for points 3 and 4:
- Negative T wave over the infarct area.
Can an ECG fail to show a heart attack?
There are situations when the signs of MI on the ECG are not very convincing or are completely absent. Moreover, this happens not only in the first hours, but even throughout the day from the moment of illness. The reason for this phenomenon is the zones of the myocardium (the left ventricle behind and its high parts in front), which are not displayed on a routine 12-lead ECG. Therefore, a picture characteristic of MI is obtained only by taking an electrocardiogram in additional versions: according to Neb, according to Slapak, according to Kleten. Also used for diagnosis is a cardiovisor, a device that detects hidden pathological changes in the myocardium.
Determination of stage
Previously, there were four stages of MI:
- acute;
- acute;
- subacute;
- scarring.
In the latest classifications, the first stage is called acute coronary syndrome (ACS).
| Stage and its duration | ECG signs |
| OKS (2-4 hours) |
|
| Acute (1-2 weeks, maximum 3) |
|
| Subacute (from 2 weeks to 1.5-2 months) |
|
| Scarring |
|
The properties of the first three stages include reciprocal changes - when compared, in leads opposite to the pathological process, the opposite deviations are observed (elevation instead of depression, positive T instead of negative).
Photo with transcript
Rice. 1. Acute coronary syndrome.
Rice. 2. Acute coronary syndrome-2.
Fig 3. Acute myocardial infarction.
Rice. 4. Subacute myocardial infarction.
Rice. 5. Scarring stage.
ECG picture depending on the stage of infarction
Zones of myocardial ischemia on the ECG
When the blood supply to any part of the heart muscle is cut off, muscle cells in that area die. At the edges of the myocardial ischemia zone, the cells of the conduction system do not die, but their performance is impaired. After the blood supply is restored, the functioning of the damaged tissues usually returns to normal. That is, this is the area that can be saved with early endovascular intervention. These functions are displayed depending on the stage and strength of MI development. They are divided into:
- acute;
- spicy;
- subacute;
- cicatricial
There are only two types of lesions: small-focal and large-focal infarction (a severe version of large-focal infarction is transmural infarction). Large-focal MI is called a “Q-forming infarction.”
Typical dynamics of the stages of infarction on the ECG
1. The most acute stage lasts 3 - 72 hours. During this time, the formation of necrosis and the Q wave may occur. Elevation of the ST segment outside the isoline is observed. The most acute stage can be recognized by the formation of a monophasic curve (cat's back).
ST segment elevation on ECG
2. The acute stage lasts 14-20 days. It is characterized by a clear localization of the ischemic zone and existing damage. In case of AMI, the ST segment comes close to the isoline and covers the T wave.
3. The subacute phase can last up to three months. The damaged area is replaced by connective tissue. The patient's condition is stabilized. When repeating the ECG, ST elevation to the isoline is recorded.
4. The scar stage is the stage of formation of a strong connective tissue scar. In other words, this is a scar that will not disappear for the rest of your life. When deciphering the ECG tape, the ST segment does not go beyond the isoline. During scarring, the amplitude of the T wave should not exceed 5 mm, and it is also important that its height does not reach the middle of Q and R in the same lead. An old scar of unknown date is recorded on the ECG tape in the form of a scar.
MI can be large-focal or small-focal. This takes into account how extensive the area of damage to the heart muscle is.
transmural Q infarction ECG - stages of development
ECG, part 3c. ECG changes during myocardial infarction
This is the last and most difficult part of my ECG cycle. I’ll try to tell you in an accessible way, using the “ Guide to Electrocardiography”
"V. N. Orlova (2003).
Heart attack
(lat. infarcio -
I stuff
) - necrosis (death) of tissue due to cessation of blood supply.
The reasons for stopping blood flow can be different - from blockage (thrombosis, thromboembolism) to a sharp spasm of blood vessels. A heart attack can occur in any organ
, for example, a cerebral infarction (stroke) or a kidney infarction.
In everyday life, the word “heart attack” means precisely “ myocardial infarction
,” i.e.,
necrosis of the muscle tissue of the heart
.
In general, all heart attacks are divided into ischemic
(more often) and
hemorrhagic
. With an ischemic infarction, the flow of blood through the artery stops due to some obstacle, and with a hemorrhagic infarction, the artery bursts (ruptures) with the subsequent release of blood into the surrounding tissues.
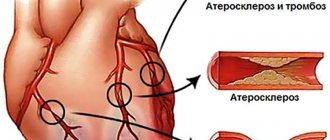
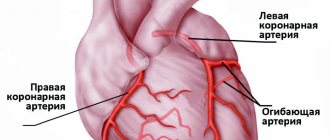
Myocardial infarction does not affect the heart muscle randomly, but in certain places
.
The fact is that the heart receives arterial blood from the aorta through several coronary (coronary) arteries and their branches. If, using coronary angiography
, you find out at what level and in which vessel the blood flow has stopped, you can predict which part of the myocardium suffers from
ischemia
(lack of oxygen). And vice versa.
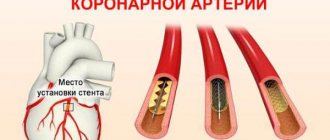
Myocardial infarction occurs when blood flow through one or more arteries of the heart is stopped
.
Coronary angiography is a study of the patency of the coronary arteries of the heart by injecting them with a contrast agent and taking a series of x-rays to assess the speed of contrast spread.
From school we remember that the heart has 2 ventricles and 2 atria
, therefore, logically, they should all be affected by a heart attack with the same probability.
However, it is the left ventricle that always suffers from a heart attack
, because its wall is the thickest, is subject to enormous stress and requires a large blood supply.
Heart chambers in section
. The walls of the left ventricle are much thicker than the right.
Isolated atrial and right ventricular infarctions
- a huge rarity.
Most often, they are affected simultaneously with the left ventricle, when ischemia moves from the left ventricle to the right or to the atria. According to pathologists, the spread of a heart attack from the left ventricle to the right is observed in 10-40%
of all patients with a heart attack (the transition usually occurs along the posterior wall of the heart).
Transition to the atria occurs in 1-17%
of cases.
Stages of myocardial necrosis on ECG
Between healthy and dead (necrotic) myocardium, intermediate stages are distinguished in electrocardiography: ischemia
and
damage
.
ECG appearance is normal
.
Thus, the stages of myocardial damage during a heart attack are as follows:
- ISCHEMIA: this is the initial damage to the myocardium, in which There are no microscopic changes in the heart muscle yet, but the function is already partially impaired
.As you should remember from the first part of the cycle, two opposing processes sequentially occur on the cell membranes of nerve and muscle cells: depolarization
(excitation) and
repolarization
(restoration of the potential difference).
Depolarization is a simple process, for which you only need to open ion channels in the cell membrane, through which, due to the difference in concentrations, ions will flow outside and inside the cell. Unlike depolarization, repolarization is an energy-intensive process
that requires energy in the form of ATP.
Oxygen is necessary for the synthesis of ATP, therefore, during myocardial ischemia, the repolarization process first begins to suffer. Repolarization disturbance is manifested by changes in the T wave
.Variants of T wave changes during ischemia
: a - normal, b -
negative symmetrical "coronary" T wave
(occurs with a heart attack), c -
high positive symmetrical "coronary" T wave
(with a heart attack and a number of other pathologies, see below), d, e - biphasic T wave , f - reduced T wave (amplitude less than 1/10-1/8 R wave), g - smoothed T wave, h - slightly negative T wave.With myocardial ischemia, the QRS complex and ST segments are normal, but the T wave is changed: it is widened, symmetrical, equilateral, increased in amplitude (span) and has a pointed apex
.
In this case, the T wave can be either positive or negative - this depends on the location of the ischemic focus in the thickness of the heart wall, as well as on the direction of the selected ECG lead. Ischemia is a reversible phenomenon
, over time the metabolism (metabolism) is restored to normal or continues to deteriorate with the transition to the damage stage. - DAMAGE: this deeper defeat
myocardium, in which
determined under a microscope
an increase in the number of vacuoles, swelling and degeneration of muscle fibers, disruption of membrane structure, mitochondrial function, acidosis (acidification of the environment), etc. Both depolarization and repolarization suffer. The injury is thought to primarily affect the ST segment.
The ST segment may move above or below the baseline
, but its arc (this is important!) when damaged
convex in the direction of displacement
. Thus, when the myocardium is damaged, the arc of the ST segment is directed towards the displacement, which distinguishes it from many other conditions in which the arc is directed towards the isoline (ventricular hypertrophy, bundle branch block, etc.).Options for ST segment displacement in case of damage
.
T wave
when damaged, it can be of different shapes and sizes, which depends on the severity of concomitant ischemia. The damage also cannot exist for long and turns into ischemia or necrosis.
- NECROSIS: myocardial death
. Dead myocardium is unable to depolarize, so dead cells cannot form an R wave in the ventricular QRS complex. For this reason, when
transmural infarction
(death of the myocardium in a certain area along the entire thickness of the heart wall) in this ECG lead of the tooth
There is no R at all
, and is formed
ventricular complex type QS
. If necrosis affected only part of the myocardial wall, a complex like
QrS
, in which the R wave is reduced and the Q wave is increased compared to normal.Variants of the ventricular QRS complex
.
Normally, the Q and R waves must obey a number of rules
, For example:
- the Q wave should always be present in V4-V6.
The width of the Q wave should not exceed 0.03 s, and its amplitude should NOT exceed 1/4 of the amplitude of the R wave in this lead.
- wave should increase in amplitude from V1 to V4
(i.e., in each subsequent lead from V1 to V4, the R wave should howl higher than in the previous one). - in V1, the r wave may normally be absent
, then the ventricular complex has the appearance of QS.
In people under 30 years of age, the QS complex can normally occasionally be in V1-V2, and in children - even in V1-V3, although this is always suspicious for infarction of the anterior part of the interventricular septum
.
What does an ECG look like depending on the area of infarction?
So, simply put, necrosis affects the Q wave
and for the entire ventricular QRS complex.
The damage
affects
the ST segment
.
Ischemia
affects
the T wave
.
The formation of waves on the ECG is normal
.
Next, let’s look at the drawing I improved from V. N. Orlov’s “Manual on Electrocardiography”, in which there is a necrosis zone
, along its periphery there is
a damage zone
, and outside there is
an ischemic zone
. Along the wall of the heart are the positive ends of the electrodes (from No. 1 to 7).
To make it easier to understand, I have drawn conditional lines that clearly show which zones the ECG is recorded from in each of the indicated leads:
Schematic view of the ECG depending on the infarction zone
.
- Electrode No. 1: located above the transmural infarction area, so the ventricular complex has a QS appearance.
- No. 2: non-transmural infarction (QR) and transmural injury (ST elevation with upward convexity).
- No. 3: transmural injury (ST elevation with upward convexity).
- No. 4: here in the original drawing it is not very clear, but the explanation indicates that the electrode is located above the zone of transmural damage (ST elevation) and transmural ischemia (negative symmetrical “coronal” T wave).
- No. 5: above the zone of transmural ischemia (negative symmetrical “coronary” T wave).
- No. 6: the periphery of the ischemic zone (biphasic T wave, i.e. in the form of a wave. The first phase of the T wave can be either positive or negative. The second phase is opposite to the first).
- No. 7: away from the ischemic zone (reduced or smoothed T wave).
Here is another picture for you to analyze on your own (“Practical electrocardiography”, V.L. Doshchitsin).
Another diagram of the dependence of the type of ECG changes on the infarction zones
.
Stages of infarction development on the ECG
The meaning of the stages of development of a heart attack is very simple. When the blood supply completely stops in any part of the myocardium, then in the center of this area the muscle cells die quickly (within several tens of minutes). At the periphery of the lesion, cells do not die immediately. Many cells gradually manage to “recover”; the rest die irreversibly (remember how I wrote above that the phases of ischemia and damage cannot exist for too long?). All these processes are reflected in the stages of development of myocardial infarction. There are four of them: acute, acute, subacute, cicatricial
. Below I present the typical dynamics of these stages on the ECG according to Orlov’s guidance.
1) The most acute stage of a heart attack
(
damage stage
) has an approximate duration
of 3 hours to 3 days
.
Necrosis and its corresponding Q wave may begin to form, but it may not exist. If the Q wave is formed, then the height of the R wave in this lead decreases, often to the point of complete disappearance (QS complex with transmural infarction). The main ECG feature of the most acute stage of myocardial infarction is the formation of the so-called monophasic curve
.
A monophasic waveform consists of an ST segment elevation and a tall, upright T wave
that merge together.
Displacement of the ST segment above the isoline by 4 mm or more
in at least one of the 12 regular leads indicates the severity of heart damage.
Note. The most attentive visitors will say that myocardial infarction cannot begin precisely at the stage of damage
the ischemia phase
described above !
Right. But the ischemic phase lasts only 15-30 minutes
, so the ambulance usually does not have time to register it on the ECG.
However, if this is possible, the ECG shows high positive symmetrical “coronary” T waves
, characteristic of
subendocardial ischemia
. It is under the endocardium that the most vulnerable part of the myocardium of the heart wall is located, since there is increased pressure in the heart cavity, which interferes with the blood supply to the myocardium (“squeezes” blood out of the heart arteries back).
2) Acute stage
lasts
up to 2-3 weeks
(to make it easier to remember - up to 3 weeks).
Areas of ischemia and damage begin to decrease. The necrosis zone expands, the Q wave also expands and increases in amplitude
.
If the Q wave does not appear in the acute stage, it is formed in the acute stage (however, there are heart attacks without the Q wave
, more about them below).
The ST segment
, due to the limitation of the damage zone
begins to gradually approach the isoline
, and
the T wave
becomes
negatively symmetrical “coronal”
due to the formation of a zone of transmural ischemia around the damage zone.
3) Subacute stage
lasts up to 3 months, occasionally longer.
The damaged zone disappears due to the transition to the ischemic zone (therefore, the ST segment comes close to the isoline), the necrosis zone stabilizes
(therefore,
the true size of the infarction
is judged at this stage).
In the first half of the subacute stage, due to the expansion of the ischemic zone, the negative T wave widens and increases in amplitude
up to a giant one.
In the second half, the ischemia zone gradually disappears, which is accompanied by normalization of the T wave (its amplitude decreases, it tends to become positive). The dynamics of changes in the T wave are especially noticeable at the periphery
of the ischemic zone.
If ST segment elevation has not returned to normal after 3 weeks of the heart attack
, it is recommended to do
echocardiography (EchoCG)
to exclude
cardiac aneurysm
(sac-like expansion of the wall with slow blood flow).
4) Scar stage
myocardial infarction.
This is the final stage, in which a strong connective tissue scar
. It is not excited and does not contract, therefore it appears on the ECG as a Q wave. Since a scar, like any scar, remains for the rest of life, the scar stage of a heart attack lasts until the last contraction of the heart.
Stages of myocardial infarction
.
What ECG changes occur during the scar stage?
The scar area (and therefore the Q wave) can
be reduced
due to:
- tightening ( compaction) of scar tissue
, which brings together intact areas of the myocardium; - compensatory hypertrophy
(enlargement) of neighboring areas of healthy myocardium.
There are no zones of damage and ischemia in the scar stage, therefore the ST segment is on the isoline, and the T wave is positive, reduced or smoothed
.
, a small negative T wave
is still recorded , which is associated with constant
irritation of the adjacent healthy myocardium by scar tissue
.
In such cases, the T wave should not exceed 5 mm
and should not be longer than half of the Q or R wave in the same lead.
To make it easier to remember, the duration of all stages obeys the rule of three and increases incrementally:
- up to 30 minutes (ischemia phase),
- up to 3 days (acute stage),
- up to 3 weeks (acute stage),
- up to 3 months (subacute stage),
- the rest of life (scar stage).
In general, there are other classifications of the stages of infarction.
Differential diagnosis of infarction on ECG
In the third year while studying pathological anatomy and physiology
Every medical student must learn that all reactions of the body to the same influence in different tissues at the microscopic level proceed
in the same way
.
The sets of these complex sequential reactions are called typical pathological processes
.
Here are the main ones: inflammation, fever, hypoxia, tumor growth, dystrophy
, etc.
With any necrosis, inflammation develops, resulting in the formation of connective tissue. As I indicated above, the word heart attack
comes from Lat.
infarcio
-
I stuff
, which is caused by the development of inflammation, swelling, migration of blood cells into the affected organ and, consequently, its
compaction
.
At the microscopic level, inflammation occurs in the same way anywhere in the body. For this reason, infarction-like ECG changes
also occur
with heart injuries and heart tumors
(heart metastases).
Not every “suspicious” T wave, deviated ST segment or suddenly appearing Q wave is caused by a heart attack.
Normal T wave
ranges from 1/10 to 1/8 of the amplitude of the R wave. A high positive symmetrical “coronary” T wave occurs not only with ischemia, but also with
hyperkalemia, increased tone of the vagus nerve, pericarditis
(see ECG below), etc.
ECG for hyperkalemia
(A - normal, B-E - with increasing hyperkalemia).
T waves may also appear abnormal due to hormonal imbalances
(hyperthyroidism, menopausal myocardial dystrophy) and with changes in the
QRS
(for example, with bundle branch blocks). And these are not all the reasons.
Features of the ST segment and T wave
for various pathological conditions.
ST segment
can
rise above the isoline
not only with myocardial damage or infarction, but also with:
- heart aneurysm,
- PE (pulmonary embolism),
- Prinzmetal's angina,
- acute pancreatitis,
- pericarditis,
- coronary angiography,
- secondary - with bundle branch block, ventricular hypertrophy, early ventricular repolarization syndrome, etc.
ECG option for pulmonary embolism
: McGean-White syndrome (deep S wave in lead I, deep Q and negative T wave in lead III).
ST segment depression
cause not only a heart attack or myocardial damage, but also other reasons:
- myocarditis, toxic myocardial damage,
- taking cardiac glycosides, aminazine,
- post-tachycardia syndrome,
- hypokalemia,
- reflex causes - acute pancreatitis, cholecystitis, stomach ulcer, hiatal hernia, etc.,
- shock, severe anemia, acute respiratory failure,
- acute cerebrovascular accidents,
- epilepsy, psychosis, tumors and inflammation in the brain,
- smoking,
- hunger or overeating
- carbon monoxide poisoning,
- secondary - with bundle branch block, ventricular hypertrophy, etc.
Q wave
most specific for myocardial infarction, but it can also
temporarily appear and disappear
in the following cases:
- cerebral infarctions (especially subarachnoid hemorrhages),
- acute pancreatitis,
- shock,
- coronary angiography,
- uremia (end stage of acute and chronic renal failure),
- hyperkalemia,
- myocarditis, etc.
As I noted above, there are heart attacks without a Q wave
on the ECG. For example:
- in the case of subendocardial infarction
, when a thin layer of myocardium dies near the endocardium of the left ventricle.
Due to the rapid passage of excitation in this zone, the Q wave does not have time to form
.
On the ECG, the height of the R wave decreases
(due to loss of excitation of part of the myocardium) and
the ST segment drops below the isoline with a convexity downward
. - intramural
myocardial infarction (inside the wall) - it is located in the thickness of the myocardial wall and does not reach the endocardium or epicardium.
Excitation bypasses the infarction zone on both sides, and therefore the Q wave is absent. But around the infarction zone, transmural ischemia
, which manifests itself on the ECG as a negative symmetrical “coronary” T wave. Thus, intramural myocardial infarction can be diagnosed by the appearance of
a negative symmetrical T wave
.
You also need to remember that an ECG is only one of the research methods
when establishing a diagnosis, although a very important method. In rare cases (with atypical localization of the necrosis zone), myocardial infarction is possible even with a normal ECG! I’ll dwell on this a little further.
How do ECGs distinguish heart attacks from other pathologies?
According to 2 main signs
.
1) characteristic ECG dynamics
.
If the ECG shows changes in the shape, size and location of teeth and segments typical of a heart attack over time, we can speak with a high degree of confidence about a myocardial infarction. In heart attack departments of hospitals, ECGs are performed daily
.
To make it easier to assess the dynamics of the infarction on the ECG (which is most pronounced on the periphery of the affected area
), it is recommended to apply
marks to the places where the chest electrodes are applied
so that subsequent hospital ECGs are taken in the chest leads completely identically.
An important conclusion follows from this: if pathological changes have been detected in a patient’s cardiogram in the past, it is recommended to have a “control” copy of the ECG at home
so that the emergency doctor can compare the new ECG with the old one and draw a conclusion about the age of the detected changes.
If the patient has previously suffered a myocardial infarction, this recommendation becomes an ironclad rule
. Every patient who has had a heart attack should receive a follow-up ECG upon discharge and keep it where they live. And on long trips, take it with you.
2) presence of reciprocity
.
Reciprocal changes are “mirror” (relative to the isoline) ECG changes on the opposite wall
of the left ventricle. Here it is important to consider the direction of the electrode on the ECG. The center of the heart (the middle of the interventricular septum) is taken as the “zero” of the electrode, so one wall of the heart cavity lies in the positive direction, and the opposite wall lies in the negative direction.
The principle is this:
- for the Q wave, the reciprocal change will be an increase in the R wave
, and vice versa. - if the ST segment shifts above the isoline, then the reciprocal change will be a shift of ST below the isoline
, and vice versa. - for a high positive "coronal" T wave, the reciprocal change will be a negative T wave
, and vice versa.
ECG for posterior phrenic (lower) myocardial infarction
.
Direct
signs are visible in leads II, III and aVF,
reciprocal
- in V1-V4.
Reciprocal changes on the ECG in some situations are the only
, which can be used to suspect a heart attack.
For example, with a posterobasal (posterior)
myocardial infarction, direct signs of a heart attack can be recorded only in lead
D (dorsalis) along the Sky
[read e] and
in additional chest leads V7-V9
, which are not included in the standard 12 and are performed only on demand.
Additional chest leads V7-V9
.
Concordance
ECG elements - unidirectionality in relation to the isoline of the same ECG waves in different leads (that is, the ST segment and the T wave are directed in the same direction in the same lead). It happens with pericarditis.
The opposite concept is discordance
(multi-directional). Typically, this implies discordance of the ST segment and T wave in relation to the R wave (ST is deviated in one direction, T in the other). Characteristic of complete blockades of the His bundle.
ECG at the onset of acute pericarditis
: there is no Q wave and reciprocal changes, concordant changes in the ST segment and T wave are characteristic.
It is much more difficult to determine the presence of a heart attack if there is an intraventricular conduction disorder
(bundle branch block), which in itself changes a significant part of the ECG beyond recognition from the ventricular QRS complex to the T wave.
Types of heart attacks
Just a couple of decades ago, transmural infarctions
(ventricular complex type QS) and
non-transmural large focal infarctions
(type QR), but it soon became clear that this does not give anything in terms of prognosis and possible complications.
For this reason, infarctions are now simply divided into Q-infarctions
(myocardial infarctions with a Q wave) and
non-Q infarctions
(myocardial infarctions without a Q wave).
Localization of myocardial infarction
The ECG report must indicate the area of infarction
(for example: anterolateral, posterior, inferior). To do this, you need to know in which leads ECG signs of different locations of infarction appear.
Here are a couple of ready-made schemes:
Diagnosis of myocardial infarction by location
.
Topical diagnosis of myocardial infarction
(elevation
- rise, from the English
elevation
;
depression
- decrease, from the English
depression
)
Finally
If you did not understand anything from what was written, do not be upset. Myocardial infarction and, in general, ECG changes in coronary heart disease are the most difficult topic in electrocardiography for students
medical university
At the Faculty of Medicine, ECG begins to be studied from the third year in propaedeutics of internal diseases
and is taught for another 3 years until receiving a diploma, but few graduates can boast of stable knowledge on this topic. I had a friend who (as it turned out later) after the fifth year was specially assigned to a subordination in the obstetrics and gynecology department in order to have fewer encounters with ECG tapes that were difficult for her to understand.
If you want to more or less understand the ECG, you will have to spend many tens of hours on thoughtful reading
tutorials and
view hundreds of ECG tapes
. And when you can draw an ECG from memory of any heart attack or rhythm disorder, congratulate yourself - you are close to the goal.
How can you determine the location of a heart attack on an electrocardiogram?
After myocardial infarction, the location of necrosis can be found in different parts of the heart muscle. It can be located in the area:
• anterior septum;
• anterior wall of the left ventricle;
• back wall;
• from the side;
• lower part;
• combined arrangement.
The right ventricle is not subjected to heavy loads. Therefore, myocardial infarction in this part of the heart is less common. In this case, the description of the ECG result is different:
• an increase in the ST segment and the appearance of a Q wave;
• inhibition of the T wave;
• slight increase in ST wave in the thoracic area;
• In lead V2 there is a decrease in ST.
According to statistics, left ventricular infarction is more common. This is explained by the fact that the walls in this part of the heart are most thickened. The entire load falls on the left ventricle and requires more blood circulation.
ECG signs of anterior wall infarction
Electrocardiographic signs of LAD occlusion in anterior infarction: D1=first diagonal artery, S1=first septal artery, LAD=anterior interventricular/anterior descending artery, STD=ST depression, STE=ST elevation, RBBB=right bundle branch block.
ECG algorithm for identifying the localization of lesions in the LAD
With ST elevation in leads V1-V6 LAD=anterior interventricular artery, RBBB=right bundle branch block, D1=1st diagonal artery, S1=1st septal artery, STD=ST depression, STE-ST elevation, E = sum
Clinical example
The ECG shows ST segment elevation in leads V2, V3, I, aVL and ST depression in the inferior leads, suggesting occlusion of the anterior descending artery, which was confirmed by coronary angiography (Figure B).
Diagnosis of inferior wall infarction
How to determine the location of infarction with ST elevation in the inferior leads
If we detect ST elevation in the “lower” leads II, III, aVF, we look at lead V4R: if V4R is present, we suspect occlusion of the anterior interventricular artery and proceed to the algorithm for identifying it. If V4R is absent, we diagnose a lesion of the right coronary or circumflex artery: ST elevation in I - OA lesion, ST depression in I - RCA lesion, on the isoline - compare ST elevation in II and III, if II > III - OA lesion, vice versa - defeat of the RCA.
Also, by changes in ST in lead V4R, it is possible to differentiate between lesions of the OA, the proximal third of the RCA and the distal third of the RCA:
Clinical example
Infarction of the inferior wall: we see ST segment elevation in the inferior leads, with elevation in lead III > II. We also see depression in leads I and aVL. This picture suggests occlusion of the right coronary artery, which was revealed by selective coronary angiography (Figure B)
Infarction according to the “depth” of the lesion
• transmural;
• subendocardial;
• intramural.
For each form, the characteristic signs are determined by the state of the zones of necrosis and damage. With transmural MI, signs of macrofocal necrosis appear. The entire thickness of the walls from the endocardium to the pericardium is affected.
Subendocardial infarction also occurs very extensively and can be large-focal. But during the development of a heart attack, diagnosis is difficult due to the blurring of the boundaries of the affected area. Even with myocardial hypertrophy, activity in subendocardial fibers increases and with the development of MI the indicators do not decrease. The diagnosis of subendocardial infarction is confirmed if signs of the disease do not disappear within two days.
The intramural form of MI is less common in medical practice. To identify this type, the patient is observed for two weeks. It happens that the patient suffers an attack on his feet. This type of pathology refers to small focal necrosis. The diagnosis can be confirmed or refuted only after a thorough analysis of the signs of pathology development.
A heart attack can also be:
1. Circular, which is characterized by damage to the apex of the heart. Circular infarction develops in an arcuate shape and passes through the posterior wall to the anterior, lateral or lower parts. A left ventricular infarction occurs with irreversible consequences.
2. Septal, arising between the ventricular septum. In the process, the heart muscle completely dies due to lack of blood supply.
Topical diagnosis includes 5 types of localization of left ventricular infarction, which cannot be hidden. The table below explains them in more detail.
Types of localization Indicators Leads
Anteroseptal V1-4 II, III, AVF
Posterior diaphragmatic II, III, AVF I, AVF
Posterolateral I, AVL, V5 VI
Posterobasal with extension to the basal sections. missing V1, V5
Septal V1, V2, QS missing
In case of right ventricular infarction, changes can only be recorded in other leads V3R - V4R.
Localization of damage
It is important to be able to determine where the heart attack is located, since treatment tactics and prognosis will depend on this.
The table below shows data on various locations of myocardial infarction.
| Localization of MI | Direct changes | Reciprocal changes |
| Anteroseptal | V1-V3 | III, aVF |
| Anterior-apical | V3-V4 | III, aVF |
| Anterolateral | I, aVL, V3-V6 | III, aVF |
| Anterior common | I, aVL, V1-V6 | III, aVF |
| Side | I, aVL, V5-V6 | III, aVF |
| High side | I, aVL, V52-V62 | III, aVF (V1-V2) |
| Inferior (posterior diaphragmatic) | II, III, aVF | I, aVL, V2-V5 |
| Posterobasal | V7-V9 | I,V1-V3,V3R |
| Right ventricle | V1, V3R-V4R | V7-V9 |
ECG - signs depending on the size of the lesion
A large-focal MI in a photocardiogram will show a pathological Q wave. For example, the occurrence of a Q-myocardial infarction in part of the anterior wall of the left ventricle usually occurs due to blockage of the anterior artery. Signs of the development of a heart attack on the ECG with this pathology look something like this:
• Q wave outside the R wave line;
• R is equal to Q;
• T—negative wave;
• upward push of the ST segment.
Large focal MI in patients with bundle branch block is very difficult to determine. To avoid making a mistake in making a diagnosis, scientists have identified several signs that may indicate the development of a heart attack.
The interpretation of the electrocardiogram reflects:
• manifestation on the film of the cardiogram of the Q wave in 2 or more leads (VL, I, v5, v6);
• identification of Cabrera's sign in leads v3-v5;
• ST shift to two adjacent leads;
• decrease of the R wave from v1 to v4.
Identification of even one indicator from the above list increases the risk of developing MI by 90%.
Small focal MI is characterized by a weak clinical picture. The condition occurs against the background of cardiac ischemia with minor muscle necrosis. A heart attack suffered on the legs, the time of ECG diagnostics, reflects changes in the ST segment and T wave.
It could be:
• absence of any QRS changes;
• decrease in the R wave depending on previous results;
• location of the ST segment below the isoline;
• the appearance of a patholic T wave.
Thus, infarctions are divided into Q-infarctions (large-focal) and non-Q-infarctions (small-focal).
Important to remember!
- If changes on the ECG indicate a posterobasal myocardial infarction, it is necessary to remove the right chest leads so as not to miss a possible right ventricular infarction. After all, this is the zone of blood supply to the right coronary artery. And the right coronary type of blood supply is dominant.
- If a patient is admitted with a clinical picture of acute coronary syndrome, and when recording an ECG there are no changes or signs of pathology, do not rush to exclude MI. In this case, it is necessary to take an ECG, placing electrodes 1-2 intercostal spaces above and recording additionally in the right chest leads.
- Myocardial infarction is a disease that requires mandatory monitoring over time.
- Acute right or left bundle branch block is the equivalent of ST segment elevation.
- The absence of ECG dynamics, reminiscent of an extensive transmural myocardial infarction, may indicate a formed cardiac aneurysm.
Additional studies for heart attack
The interpretation of the cardiogram may sometimes not correspond to the ongoing clinical picture. It can be difficult to recognize a possible MI, and changes on the ECG tape may be caused by other diseases. Example: An ECG pattern simulating a large-focal infarction occurs with pulmonary embolism. The disease threatens human life and changes in the electrocardiogram should be taken extremely seriously.
Laboratory diagnosis of heart attack
To make a correct diagnosis, doctors conduct additional research methods. During the development of necrosis, different types of proteins are found in the blood. Laboratory diagnostics in this case involves taking a general blood test. Its results determine the presence of inflammatory processes. Biochemistry (biological markers) is presented as:
1. Counting the number of myoglobin.
2. Creatine phosphokinase (CPK) measurements.
3. Determination of lactate dehydrogenase activity.
4. Testing for troponin T.
For many years, medicine has used blood tests for ALT, AST, and LDH to diagnose MI. Now doctors complement the diagnosis with a study of the gas and electrolyte composition of the blood and general clinical studies. Only the results of laboratory and instrumental research methods confirm the development of myocardial infarction.
conclusions
The disease described is an extremely serious and life-threatening pathology. A person’s life depends on its timely diagnosis and treatment. Therefore, people should be very careful about their health and seek emergency help if symptoms of myocardial infarction appear. The examination of such a patient necessarily begins with an ECG. If latent forms are suspected, a cardiogram is taken in additional leads. If a patient who has previously suffered a heart attack has clinical signs of such a pathology, then a repeat episode of the disease is suspected. But often on the ECG, due to the scar from previously suffered atherothrombosis, new changes may not be seen. In such situations, additional research methods are used to determine markers of MI in the blood.