Infographics for the “bio/mol/text” competition: A clinical blood test is the most common laboratory test prescribed by a doctor when we come to an appointment and complain of feeling unwell. “Blood from a finger, tomorrow from 8:00 to 9:30, on an empty stomach, Nth office,” several generations have invariably heard this phrase. However, blood testing technology has undergone great changes in recent decades and has moved from manual methods to automatic ones. Let's figure out how your grandmother's blood was analyzed and why things are done differently now.
Competition "bio/mol/text"-2019
This work was published in the category “Visually about the beloved” of the “bio/mol/text” competition-2019.
The general sponsor of the competition and partner of the Skoltech nomination is the Skoltech Center for Life Sciences.
Competition sponsor: the largest supplier of equipment, reagents and consumables for biological research and production.
The audience award was sponsored by BioVitrum.
"Book" sponsor of the competition - "Alpina Non-Fiction"
Clinical significance of a blood test (excerpt from a lecture by Prof. E.B. Vladimirskaya)
Hematology:
12.03.2009
Doctor of Medical Sciences, Prof. E.B. Vladimirskaya Research Institute of Pediatric Hematology, Ministry of Health of Russia
Blood, being the internal environment of the body, carries within itself the stigmata of the vital functions of various organs and systems, the study of which is of undoubted clinical significance and is necessary for the diagnosis, prognosis of the course and monitoring of therapy of almost all internal human diseases.
The most accessible is the study of the morphological composition of blood; its results are included in the diagnostic algorithm for most pathological processes.
Since the first studies of blood under a microscope without the use of staining (the middle of the last century), blood cells have been divided into red - erythrocytes (based on the color of hemoglobin) and white - leukocytes. Leukocytes, in turn, are divided into cells containing specific granularity in the cytoplasm, and according to the ratio of this granularity to color, they are divided into (neutrophils, eosinophils and basophils) and those without - lymphocytes and monocytes. Based on the shape of the nucleus, the former are often called polymorphonuclear cells, and the latter are called mononuclear cells.
In recent years, clinical blood tests have increasingly been performed on automatic counters, which significantly increases the accuracy of calculations, but, however, does not negate the value of data obtained “manually” using light-optical microscopy. A comparison of the results of these two methods, together with the reference values of the indicators used, is presented in Table 1.
Table 1
| Automatic counting | Units _ | Normal limits | Manual counting |
| hgb -hemoglobin | g/liter | M: 132 - 173 F: 117 - 155 | Hb |
| rbc- red blood cells | 1012 /liter | M: 4.3 – 5.7 F: 3.8 – 5.1 | er. |
| hct-hematocrit | % | M: 39 – 49 F: 35 – 45 | ht |
| mcv - average volume red blood cell | 1 µm3 = 1 femtoliter | 80,0 – 95,0 | Spherical index (3,2-3,4) |
| mch - average hemoglobin content in an erythrocyte | picograms 1 g = 1012 picograms | 27,0 – 31,0 | Color index (0,85 – 1,0) Color.= Nb (g/l) x 3_____ Er (first three digits) |
| mchc – average concentration of HB in 1 erythrocyte | g/dl | 32,0 — 36,0 | |
| rdwwidth of distribution of red blood cells by volume | width histograms | 11,5 – 14,5 | No analogue |
| plt – platelets | *109 /l | 150 — 400 | Platelets |
| wbc- leukocytes | *109 /l | 4,5 –11,0 | Leukocytes |
| neu - neutrophils | *109 /l % | 1,8 – 5,5 47,0 – 72,0 | Neutrophils |
| lym – lymphocytes | *109 /l % | 1,2 – 3,0 19,0 – 37,0 | Lymphocytes |
| mon – monocytes | *109 /l % | 0,1 – 0,9 3,0 – 11,0 | Monocytes |
| eos – eosinophils | *109 /l % | 0,02 – 0,3 0,5 – 5,0 | Eosinophils |
| bas – basophils | *109 /l % | 0,0 – 0,07 0,0 –1,0 | Basophils |
When commenting on the data presented in the table, it is necessary to note:
- the vast majority of automatic counters do not detect young forms of leukocytes, normoblasts and reticulocytes - this data can only be obtained “manually”;
- normative values are never expressed in one figure; there is a limit of permissible fluctuations (it is presented in the table for all indicators), which fits 99.9% of the norm.
Let's analyze the clinical significance of individual blood test indicators.
Red blood counts.
Anemia is a decrease in hemoglobin below 120 g/l: mild - 110-120 g/l; average degree – 90-110 g/l; severe degree – below 90 g/l.
Based on the ratio of red blood indicators, 3 types of anemia are distinguished, which is the starting point for further diagnosis.
Microcytic-hypochromic anemia:
MCV < 80 Color.p. <0.85
MCH < 27; MCHC < 32
- Iron-deficiency anemia
- Anemia due to chronic inflammation
- Congenital spherocytic hemolytic anemia.
- Thalassemia.
Normocytic-normochromic anemias:
MCV 80 – 95
MCH = 27-31; MCHC = 32-36 Color.p. = 0.85-1.0
Acute blood loss.
- Anemia in chronic renal failure
- Anemia due to endocrine pathology.
- Anemia in cancer.
- Hemolytic anemias, immune and non-immune.
- Aplastic anemia.
- Myelodysplastic syndrome.
Hyperchromic macrocytic anemia.
MCV > 95
MCH>31; MCHC = 32-36 Color points > 1.0
- Megaloblastic B-12 is a deficiency (pernicious) anemia.
- Megaloblastic folate deficiency anemia.
- Autoimmune hemolytic anemia.
Thus, when detecting a decrease in hemoglobin, one should first determine the nature of anemia: normo-, hypo- or hyperchromic.
Let us dwell in more detail on iron deficiency anemia and anemia due to chronic inflammation, the diagnosis and treatment of which are the prerogative of general practitioners and do not require special hematological studies.
Iron deficiency anemia (IDA) is detected in 50% of women and 40% of men, representing one of the most common human diseases. The most common cause of IDA is a latent form of bleeding: in men – from the gastrointestinal tract and bronchopulmonary system, in women – menopause and metrorrhagia. Pregnancy is also one of the factors in the development of iron deficiency in women. Insufficient dietary intake of meat products is another significant and at the same time socially determined cause of the development of iron deficiency. In children born with a reserve of iron received from the mother in the last month of intrauterine development, further intake of iron occurs only from complementary foods. Thus, the reasons for the development of iron deficiency in young children may be prematurity, multiple pregnancies, late introduction of complementary foods, infections (increased iron consumption by microbial flora and malabsorption).
The clinical picture of IDA consists of the following clinical syndromes:
1. Anemia: weakness, drowsiness, fatigue, shortness of breath, palpitations, functional systolic murmur, floaters floating before the eyes.
2. Sideropenic syndrome:
· dryness, fragility, hair loss, early gray hair;
· flattening and brittleness of nails;
· dry skin, hyperkeratosis;
· painful, non-healing cracks in the corners of the mouth, tongue, fingers, toes, heels;
· perversion of taste and olfactory addictions;
· frequent infections;
· impaired swallowing, muscle weakness, sphincter weakness (urinary incontinence when laughing, coughing)
The diagnostic algorithm for IDA, in addition to a detailed clinical study to identify hidden bleeding, includes the mandatory determination of basic indicators of iron metabolism. The diagnosis of IDA is confirmed by the following values of these indicators:
- serum iron below 12.5 µmol/l
- total iron binding capacity (TIBC) above 64.4 µmol/l
- serum ferritin below 12 µg/l.
Correction of IDA is carried out by long-term oral treatment with iron preparations (6-8 weeks after hemoglobin restoration).
It is necessary to carry out a differential diagnosis between IDA and anemia in chronic inflammation.
Anemia during chronic inflammation in terms of the morphological composition of the blood is no different from IDA and is also accompanied by a decrease in serum iron content. However, its development is not based on exogenous iron deficiency, but on the impossibility of its utilization. Iron treatment for such anemia is contraindicated. Differential diagnosis is based on the study of iron metabolism indicators and is presented in Table 2.
Table 2. Differential diagnosis between IDA and anemia in chronic inflammation.
| Indicators | ZhDA | Anemia due to chronic inflammation |
| Serum iron | Reduced | Reduced |
| OZhSS | Increased | Normal or reduced |
| Serum ferritin | Reduced | Normal or increased |
To summarize the brief analysis of the clinical significance of the morphological parameters of red blood, we should dwell separately on reticulocytes and normoblasts.
A morphological sign indicating the hemolytic nature of the decrease in hemoglobin is an increase in the number of reticulocytes. With normal hemoglobin, the number of reticulocytes does not exceed 0.5-1.5%. The expected reticulocyte response to hemolytic anemia with intact hematopoiesis is presented in Table 3.
Table 3. Expected reticulocyte response to hemolytic anemia.
| Hematocrit, % | 45 | 40 | 35 | 30 | 25 | 20 | 15 |
| Hemoglobin, g/l | 130 | 120 | 115 | 100 | 83 | 66 | 50 |
| Reticulocytes, % | 0,5 | 1,5 | 5 | 10 | 15 | 20 | 30 |
Dynamic monitoring of reticulocyte levels is also necessary to assess the expected effectiveness of treatment for IDA and pernicious anemia. An increase in reticulocytes is naturally observed on days 5-8 of treatment with iron for IDA and is especially pronounced (up to 60%) on days 5-8 of treatment with vitamin B-12 for pernicious anemia. Such a hematopoietic response to the therapy of these diseases can also be considered as confirmation of the corresponding diagnosis of exjuvantibus.
Normoblastosis in peripheral blood is rare and always indicates a serious pathology. Its appearance is naturally observed in severe forms of hemolytic anemia and in patients who have undergone splenectomy. The detection of normoblasts in the blood of patients who do not suffer from this pathology should be a reason to search for oncological pathology.
about erythrocytosis when the following blood parameters are present: red blood cells above 5.7x10*12/l in men and 5.2x10*12/l in women, hemoglobin above 177 g/l and 172 g/l, respectively, hematocrit above 52% and 48 % respectively.
Primary erythrocytosis is considered to be rare genetically determined familial erythrocytosis and erythremia.
Secondary erythrocytosis, caused by increased formation of erythropoietin in response to arterial hypoxia or in certain tumors, is much more common.
Secondary erythrocytoses can be divided into the following groups:
1. Arterial hypoxia
- Altitude sickness
- Chronic pulmonary failure
- "Blue" heart defects
2. Tumors that produce erythropoietin
- Kidney tumors, hypernephroma
- Adrenal tumor
- Cerebellar hemangioma
- Ovarian cancer
3. Local renal ischemia
- Cyst
- Hydronephrosis
- Renal artery stenosis
4. Harmful production
- Cobalt poisoning
Treatment of secondary erythrocytosis requires elimination of their cause, but can also be symptomatic due to the threat of thrombosis. Symptomatic treatment of erythrocytosis is bloodletting.
White blood counts.
An increase or decrease in the number of different types of peripheral blood leukocytes can be judged only by changes in the absolute number of these formed elements.
Neutrophilia is an increase in the number of neutrophils more than 6x10*9/l.
Less commonly, neutrophilia is a manifestation of chronic myeloid leukemia, accompanied by clinical and hematological features specific to it (enlarged spleen, lymph nodes, blood rejuvenation, anemia, hyperthrombocytosis, bone marrow hyperplasia, the presence of a Ph chromosome and the chimeric c-abl-bcr gene).
Much more often, neutrophilia is a blood reaction to inflammation, the result of exposure to bacterial endotoxin and the release of inflammatory cytokines and chemokines by tissues. Neutrophilic leukocytosis can accompany any inflammation, bacterial, fungal and parasitic infections, necrotic tissue changes, hypoxemia, intoxication and tumors of various locations. With prolonged exposure to factors that induce neutrophilia, the bone marrow granulocyte reserve is depleted and young cells of the neutrophil series (band cells, metamyelocytes and myelocytes) begin to enter the blood. This blood condition is called leukemoid reaction of the neutrophil series. Sometimes it becomes necessary to make a differential diagnosis between such a reaction and the initial form of chronic myeloid leukemia. The absence of anemia, hyperthrombocytosis and a high level of alkaline phosphatase in neutrophils is characteristic of the leukemoid reaction.
Neutropenia is a decrease in the number of neutrophils less than 1.8 x 10*9/l.
Agranulocytosis - a decrease in the number of neutrophils less than 0.5 x 10*9/l.
Neutropenia can be primary (congenital and acquired), associated with blood diseases (acute leukemia, aplasia of hematopoiesis, cyclic neutropenia), and secondary, accompanying diseases, during which destruction and increased consumption of neutrophils occurs.
Secondary, reactive neutropenia includes immune and neutropenia in severe infections. Neutropenia in sepsis is usually accompanied by a rejuvenation of the leukocyte count and is a poor prognostic symptom, indicating depletion of hematopoiesis.
It is necessary to dwell on constitutional, so-called harmless neutropenias. About 4% of people have normal blood composition with a low content of neutrophils. This feature is associated with the genetically determined rapid movement of neutrophils into tissues, where they carry out their inherent protective functions. People with this blood composition are usually less susceptible to intercurrent infections and recover from them faster. However, often such patients, unfortunately, are the subject of close attention of doctors, are subjected to many unnecessary invasive studies, and they develop iatrogenic pathology. Thus, neutropenia, not accompanied by other blood changes and any clinical symptoms, does not require immediate intervention. Such patients require dynamic monitoring.
Separately, I would like to touch upon redistributive neutrophilia and neutropenia. The circulation of neutrophils has its own characteristics: half of the cells circulate with the blood (these cells are to be counted), while the other half is in the “marginal position” at the walls of the vessels. Irritation of the sympathetic system and vasospasm increase the number of circulating cells, while irritation of the parasympathetic system, on the contrary, reduces their number. Hence, stressful conditions contribute to transient neutrophilia (for example, neutrophilia in small children when screaming), and vagotonia - neutropenia.
Eosinophilia – an increase in the number of eosinophils above 0.4 x 10*9/l.
An increased release of eosinophils into the blood occurs under the influence of IL-4 and IL-5, which are formed in increased quantities during immunological tissue damage. Recently, the killer effect of eosinophils has been proven in some helminthiases and parasitic infections. Eosinophilia is a characteristic feature of collagenosis, allergies, many helminthic and parasitic infestations, immunodeficiency, especially hyper-IG-E syndrome, and some tumors.
Monocytosis – the number of monocytes is higher than 0.8 x 10*9/l.
Conditions often, but not always, associated with monocytosis include:
- Infections (especially tuberculosis, endocarditis, syphilis).
- Fever of unknown origin
- Various forms of neoplasia and myeloproliferative diseases.
- Chronic inflammation (especially cholecystitis and rheumatoid polyarthritis)
- Condition after splenectomy.
Lymphocytosis – an increase in the number of lymphocytes more than 4.0 x 10*9/l
Among malignant lymphoproliferative diseases with high lymphocytosis, the most common is chronic lymphocytic leukemia, a disease of people over 45 years of age. The distinctive feature of this lymphocytosis is its monoclonal nature and B-cell origin.
Secondary, reactive lymphocytosis , which is polyclonal in nature, accompanies many viral infections and some inflammatory and immune complex diseases. These include:
1. Lymphotropic viral diseases:
— infectious mononucleosis (atypical mononuclear cells, characteristic clinical picture);
- infectious lymphocytosis (asymptomatic epidemic form in young children - up to 20-30 thousand)
2. Cytomegalovirus infection (atypical mononuclear cells, characteristic clinical picture).
3. Childhood infections: whooping cough, chickenpox, scarlet fever prodrome.
4. Other viral infections: rubella, hepatitis, some respiratory adenoviral infections in the convalescent stage.
5. Inflammatory and immune complex diseases: thyrotoxicosis, ulcerative colitis, Crohn's disease, vasculitis.
Lymphocytopenia - a decrease in the number of lymphocytes below 1.2 x 10*9/l.
It is observed relatively rarely, most often with corticosteroid therapy. May also accompany AIDS, lymphogranulomatosis and various chronic infections (for example, tuberculosis, disseminated lupus erythematosus, sarcoidosis).
Hyperthrombocytosis is considered to be an increase in the number of platelets more than 400.0 x 10*9/l.
Primary hyperthrombocytosis accompanies myeloproliferative diseases and is a consequence of tumor transformation of the megakaryocytic lineage of the bone marrow.
Secondary reactive hyperthrombocytosis is observed:
- After surgical interventions (about 2 weeks).
- After splenectomy (up to 1 year).
- For malignant tumors
- For acute posthemorrhagic and hemolytic anemia.
- For certain inflammations (tuberculosis, acute rheumatism, ulcerative colitis, osteomyelitis).
Thrombocytopenia - a decrease in the number of platelets below 100.0 x 10*9/l most often occurs with tumor diseases of the blood, aplastic anemia and immune thrombocytopenic purpura. Thrombocytopenia is an obligatory component of the hypersplenism syndrome with splenomegaly. It should be borne in mind that a serious threat of bleeding occurs when the platelet count drops below 20.0 x 10*9/l.
Reactive thrombocytopenia is rare and can accompany any immune pathology and disseminated intravascular coagulation.
ESR - erythrocyte sedimentation rate is a nonspecific reaction. Normally, it is 2-15 mm per hour in men under 50 years old, and 2-20 mm per hour in women under 50 years old. After 50 years, men have up to 20 mm per hour, and women – up to 30 mm per hour.
The rate of erythrocyte aggregation depends on their number (it accelerates when their number decreases) and the amount of coarse proteins (inflammatory proteins, fibrinogen, antibodies, gamma globulin, etc.) adsorbed on erythrocytes and accelerating their sedimentation. Based on this, it is clear that there is a wide range of pathologies in which ESR acceleration can be detected.
Thus, analysis of the morphological composition of blood is of great clinical importance, and sometimes is a leading sign in the diagnosis and choice of therapy for many human diseases.
However, it should be remembered that the most important link in such an analysis is the integral assessment of all blood parameters and the mandatory correlation of changes in the blood with the history and clinical manifestations of the disease.
Literature:
1. Guide to Hematology, ed. A.I. Vorobyov, Moscow, 1985
2. Hematology, ed. by WSBeck, London, 1991
3. Manual of Clinical Hematology, ed.by J. Mazza, NY, 1995
Tags: Laboratory, Blood
« Back to article list Share on
What will we explore?
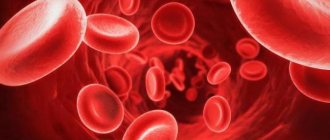
Blood is a liquid connective tissue of the body, consisting of plasma and three types of formed elements: red blood cells, platelets and leukocytes. Leukocytes, in turn, come with granules in the cytoplasm - these are neutrophils, eosinophils and basophils - and without granules - lymphocytes and monocytes. In order to distinguish pathology from the norm, you need to know what the concentration of blood cells is, what they look like and what function they perform. It's time to remember who we are dealing with.
Figure 1. Formed elements of blood [1–3]
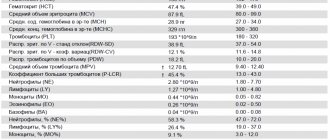
Figure 2. The figure shows: the concentrations of blood cells are normal; leukocyte formula - the percentage of different types of leukocytes in the blood; erythrocyte sedimentation rate; hemoglobin concentration; hematocrit is normal [4].
So, experts analyze the relative and absolute content of cells, their morphological characteristics, distribution over blood volume and many other parameters. These indicators can tell whether cells are able to fully perform their functions, and if not, then indicate the reason for their “inoperability” and serve as the basis for making a diagnosis.
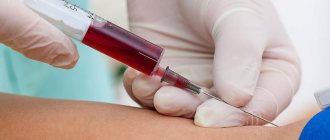
Figure 3. Blood testing: then and now
What does blood look like under a microscope?
There are several types of blood cells that have different tasks. Some of them function only within the circulatory system, others go beyond its boundaries. The only thing they have in common is that they are all formed in the bone marrow from stem cells. The process of their formation is continuous, and their lifespan is limited. Leukocytes, platelets and erythrocytes are 3 formed elements contained in biological fluid. Their number depends on the age of the person and the state of the body at the moment.
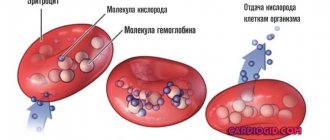
Red blood cells
Red blood cells “take” oxygen from the lungs and deliver it to all organs and tissues. On the way back, carbon dioxide is transported to the air breathing organ. These cells contain a unique protein - hemoglobin, consisting of a divalent iron atom. This is what causes the red pigment of red blood cells.
About 2-3 million of these bodies die every second, but the same number are produced every second. They live for approximately 4 months. In 1 cubic ml of blood there are about 25 million red blood cells. Their total number is 25 billion. In just one drop of blood there are about 250 million red blood cells.
An erythrocyte under a microscope has a discoid-concave shape, the average diameter of which is about 7-7.5 microns, and the thickness at the edges is 2.5 microns. This shape facilitates the “smooth” passage of red blood cells through small vessels. Over time, red blood cells lose this property, which is why they linger in the small vessels of the spleen and liver. They are destroyed in these organs.
Up to 80% of red blood cells have a spherical biconcave shape. The remaining 20% can be oval, crescent-shaped, spherical (simple), cup-shaped and other shapes. Changes in appearance are often caused by pathology (vitaminosis, anemia, etc.).
Leukocytes
These are white blood cells that have a protective function. They are usually divided into granulocytes and agranulocytes. The first group includes granular cells:
- Neutrophils. The most numerous group of leukocytes - up to 70% of the total number of white cells. The main task is to capture pathogenic microbes. The nuclear cell has a round shape, the diameter of which can reach 10 microns. The core may be rod-shaped or consist of several segments connected to each other. If the number of segments is more than 8, then this indicates the development of the disease.
- Basophils. A small group, which is represented by no more than 1% of the total number of leukocytes. The main task is to maintain the functioning of the immune system. They have a round shape and a segmented or rod-shaped nucleus. Their diameter reaches 7-11 microns.
- Eosinophils. The total number of white blood cells accounts for 2-5% of eosinophils. Their granules are stained with an acidic dye, eosin. They have a round shape and a slightly colored core, consisting of 2-3 segments of the same size. Eosinophils reach 10-11 microns in diameter. Their cytoplasm is pale blue.
In 1 cubic ml of blood there are 5-10 thousand leukocytes. The average size of white blood cells is 15 microns. Their total number in the human body reaches 35 billion.
The second group consists of cells without granules in the cytoplasm:
- Lymphocytes. Leading component of the immune system. Knowing what lymphocytes are in a blood test, doctors determine the patient’s immune status and receive information about the presence of infection and other diseases in the body. These are round cells with a large nucleus occupying most of the cytoplasm. Their diameter ranges from 7 to 10 microns. The kernel can be round, oval or bean-shaped and has a rough structure. Consists of lumps of oxychromatin and basiromatin, resembling blocks.
- Monocytes. The largest of leukocytes, responsible for nonspecific defense of the body. Their number ranges from 2 to 9% of all white blood cells. The diameter reaches 20 microns. The nucleus is large, occupies almost the entire cytoplasm, can be round, bean-shaped, mushroom-shaped, or butterfly-shaped.
Interesting! If you arrange the leukocytes in one row, you can get a distance of 525 km.
Leukogram, or leukocyte formula, is the percentage ratio of different types of leukocytes, determined by counting them in a stained blood smear under a microscope. Deciphering the leukocyte formula provides undoubted benefit in a diagnostic search, but it cannot always fully satisfy the doctor’s interest in relation to some well-masked disease. For example, the more pronounced the inflammatory process of bacterial etiology, the more neutrophils in the leukocyte formula. The presence of neutrophils of varying degrees of maturity indicates the severity of the bacterial infection. The more acute the process, the more band neutrophils in the blood.
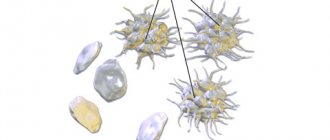
Platelets
Blood platelets are “hidden” under the platelets, which regulate the blood clotting process. They secrete the enzyme thromboplastin. When a cut or injection occurs, the platelet membrane is destroyed, thromboplastin is released and enters the plasma, and the blood clots. A blood clot forms, which protects the body from blood loss.
In 1 cubic There should be about 200-300 thousand ml of blood. The size of each platelet reaches about 3 microns. Therefore, they can only be examined in detail using a professional microscope. It turns out that the total number of these red platelets in human blood is approximately 1250 billion.
Forward to the past!
1965, 8 am, there is a line for tests at the local clinic. Your grandmother donated blood, and the laboratory assistant takes a number of test tubes for testing. Let's follow him to the laboratory and see what's there and how. In the laboratory we see doctors bending over microscopes or working with test tubes. It is no exaggeration to say that in your grandmother’s youth, a specialist’s eye and a microscope were the main tools for blood analysis. The following basic characteristics of blood are determined: the concentration of each type of formed element, the number of different types of leukocytes, the erythrocyte sedimentation rate and the concentration of hemoglobin. In addition, the specialist calculates the hematocrit - the ratio of the volume of red blood cells to the total volume of blood [5].
Calculate in order!
The first step is to count the cells and determine their concentration in the blood. The counting of red blood cells, leukocytes and platelets is carried out in the Goryaev chamber, named after its inventor. Goryaev’s chamber is a glass with a recess and a mesh applied, into which a drop of blood diluted in saline solution is placed. To determine the number of formed elements, the camera is placed under a microscope and the cells located in large and small grid squares are counted. Each type of cell has its own counting rules and formula by which their initial concentration is calculated, taking into account blood dilution and the number of grid squares [6]. Changes in the number of formed elements serve as an important criterion for the diagnosis of anemia, inflammatory and viral diseases, disorders of the blood coagulation system and other pathological conditions [7].
Who are you?
Another stage of blood testing is the differentiation of leukocytes into populations. Special attention is paid to it: a change in the concentration of a certain type of cell indicates a specific pathology. Bacterial infection, viruses or allergies? Leukocytes will tell you what diagnosis to make and what treatment to prescribe. The distinction of leukocytes is trusted only to a highly qualified specialist. To begin with, a blood smear is fixed in alcohol and stained using the Romanovsky-Giemsa method. The composition of the dye is selected in such a way that different cell structures are painted in different colors. Coloring depends on the ability of the components of the color mixture to bind to structures containing acids or bases. For example, hemoglobin and eosinophil granules acquire a red-pink color due to eosin, and the nuclei of formed elements and basophil granules (having an affinity for bases) are stained with methylene blue and blue [1]. When the smear is ready, a specialist examines it under a microscope and determines by its appearance what type of different cells they belong to [8]. The presence of colored granules, features of the shape of the nucleus, cell size - all parameters must be kept in mind for error-free classification. Typically, one hundred leukocytes were counted, followed by calculation of the percentage, and in order to avoid confusion, an 11-key counter was used [9]. If you see a cell under a microscope, press the key indicating the cell of this type, and at the end of the count, the number of leukocytes of each type will be displayed on the counter screen [10].
Precipitated
Another characteristic of clinical significance is the erythrocyte sedimentation rate (ESR). This is an indicator that evaluates the rate of separation of blood into plasma and formed elements. What is the reason for this division? Macromolecules found in blood plasma can simultaneously bind two red blood cells to each other, resulting in the formation of “coin columns” [11]. Such complexes, under the influence of gravity, settle to the bottom of the test tube, leaving a layer of transparent plasma above them - this is called erythrocyte sedimentation. An increase in erythrocyte sedimentation rate indicates pathological processes occurring in the body, such as inflammatory, infectious or oncological diseases [12].
To determine ESR, the Westergren method received worldwide recognition, but the Panchenkov method was also widespread in Russia. The operating principle of the methods is the same, only the types of tubes used differ. The blood is mixed with an anticoagulant - sodium citrate - and placed in a capillary - a thin glass tube. Red blood cells settle to the bottom of the tube within an hour, and then the height of the plasma column formed on top is measured [13]. In this way, the erythrocyte sedimentation rate is obtained, expressed in mm/h.
Taste and color
Hemoglobin is the red pigment of red blood cells that binds and transports oxygen and carbon dioxide. A decrease in hemoglobin content in red blood cells is the cause of anemia that accompanies a number of diseases. Hemoglobin concentration is determined visually using a Sali hemometer. The device looks like this: in the center is a test tube for the blood being analyzed, and on the sides are colored reference tubes. The laboratory technician adds hydrochloric acid to the blood being studied - hemoglobin turns into brown hemin. Then the blood is diluted with distilled water until its color (in the subjective opinion of the laboratory assistant!) matches the color of the standard. The liquid level obtained in the central tube corresponds to the hemoglobin concentration [14].
As you may have guessed, 50 years ago it was very easy to make a mistake when testing blood. Incorrect identification of the type of leukocyte or failure to count the formed elements - all this led to inaccurate analysis results. What has been done to prevent errors? Let's go back to our time and find out how blood is studied today.
Objectively about pseudoscientific. Dark Blood Fields: Diagnosis
4118 April 24
IMPORTANT!
The information in this section cannot be used for self-diagnosis and self-treatment.
In case of pain or other exacerbation of the disease, diagnostic tests should be prescribed only by the attending physician. To make a diagnosis and properly prescribe treatment, you should contact your doctor. Dark fields of blood: Diagnostics / Author: Alexey Vodovozov Source: / January 2010
Blood is an amazing creation of nature. It can be said without exaggeration that it is the source of life. After all, it is through the blood that we receive oxygen and nutrients, and it is through the blood that “production waste” is removed from the cells. Any illness is necessarily reflected in the blood. A number of diagnostic techniques are based on this. And charlatan ones too.
Blood was one of the first liquids that inquisitive doctors placed under the newly invented microscope. More than 300 years have passed since then, microscopes have become much more advanced, but doctors’ eyes still look at blood through eyepieces, looking for signs of pathology.
On glass
Antonie van Leeuwenhoek would definitely have received several Nobel Prizes had he lived today. But at the end of the 17th century this award did not exist, so Leeuwenhoek is content with the worldwide fame of the designer of microscopes and the fame of the founder of scientific microscopy. Having achieved 300-fold magnification in his instruments, he made many discoveries, including the first to describe red blood cells.
Leeuwenhoek's followers brought his brainchild to perfection. Modern optical microscopes are capable of magnification up to 2000 times and allow us to examine transparent biological objects, including the cells of our body.
Another Dutchman, physicist Fritz Zernike, noticed in the 1930s that the acceleration of light in a straight line makes the image of the model being studied more detailed, highlighting individual elements against a light background. To create interference in the sample, Zernike came up with a system of rings that were located both in the objective and in the condenser of the microscope. If you correctly configure (adjust) the microscope, then the waves that come from the light source will enter the eye with a certain phase shift. And this allows you to significantly improve the image of the object being studied.
The method was called phase-contrast microscopy and turned out to be so progressive and promising for science that in 1953 Zernike was awarded the Nobel Prize in Physics with the wording “For the justification of the phase-contrast method, especially for the invention of the phase-contrast microscope.” Why was this discovery so highly regarded? Previously, in order to examine tissues and microorganisms under a microscope, they had to be treated with various reagents—fixatives and dyes. It was impossible to see living cells in this situation; the chemicals simply killed them. Zernike's invention opened a new direction in science - intravital microscopy.
In the 21st century, biological and medical microscopes have become digital, capable of operating in different modes - both in phase contrast and in dark field (the image is formed by light diffracted by the object, and as a result the object appears very light against a dark background), as well as in polarized light, which often makes it possible to reveal the structure of objects that lies beyond the usual optical resolution.
It would seem that doctors should rejoice: a powerful tool for studying the secrets and mysteries of the human body has fallen into their hands. But this high-tech method was of great interest not only to serious scientists, but also to charlatans and scammers from medicine, who considered phase-contrast and dark-field microscopy a very successful way to extract certain amounts of money from gullible citizens.
She's alive and moving
From a patient who decides to undergo examination using the “Living Drop of Blood Diagnostics” method (variants of the name are “Testing on a dark-field microscope” or “Hemoscanning”), a drop of blood is taken, not stained, not fixed, applied to a glass slide and studied by viewing the sample on the monitor screen. Based on the results of the study, diagnoses are made and treatment is prescribed.
Hemoscanning can be considered the crowning achievement of fraudulent thought, a masterpiece and the highest aerobatics of near-medical quackery. Firstly, a real existing physical phenomenon is used (remember about the Nobel Prize?) and real complex medical equipment. And really expensive. The cost of a diagnostic complex costs at least 3–4 thousand dollars, and it is sold by reputable suppliers of serious medical equipment. The equipment has all the necessary - genuine and completely deserved - certificates and certificates. Secondly, no problems with licensing. Laboratory diagnostics is a completely legitimate type of medical activity, and a microscope that allows phase-contrast or dark-field microscopy is a completely legitimate medical diagnostic equipment. Moreover, it is widely used in medicine, that is, there are certified and certified specialists. Thirdly, under a microscope you can indeed detect a lot of signs of certain diseases. For example, changes in the shape of red blood cells in sickle cell anemia. You can also see intracellular parasites, all in the same red blood cells, called Bartonella. And even helminth eggs can theoretically be detected in the blood.
I see arba - I sing arba
So what's the catch? In interpretation. In how the “Dark Polish people” explain certain changes in the blood, what the discovered artifacts are called, what diagnoses are made and how they are treated. It is difficult even for a doctor to figure out that this is a hoax. You need special training, experience working with blood samples, and hundreds of examined “slides” – both stained and “live.” As in a regular field, so in a dark one. Fortunately, the author of the article has such experience, as does the experts with whom the results of the investigation were verified.
It’s rightly said – it’s better to see once. And a person will believe his own eyes much faster than all verbal exhortations. This is what the “laboratory assistants” are counting on. A monitor is connected to the microscope, which displays everything that is visible in the smear. When was the last time you saw your own red blood cells? That's it. It's interesting. And while the fascinated visitor admires the cells of his own beloved blood, the “laboratory assistant” begins to interpret what he sees. Moreover, he does this according to the principle of akyn: “I see an arba, I sing an arba.” Read in detail in the sidebar about what kind of “arba” charlatans can sing about.
After the patient is frightened and confused by incomprehensible, and sometimes downright scary pictures, he is given “diagnoses”. Most often there are many, and one is more terrible than the other. For example, they will tell you that the blood plasma is infected with fungi or bacteria. It doesn’t matter that seeing them even at such magnification is quite problematic, much less distinguishing them from each other. Microbiologists have to sow pathogens of various diseases on special nutrient media, so that later they can say exactly who has grown, what antibiotics they are sensitive to, etc. Microscopy is used in laboratory research, but either with specific dyes or even with fluorescent antibodies that attach to bacteria and thus make them visible.
But even if, purely theoretically, such a giant of the bacterial world as Escherichia coli (1–3 microns long and 0.5–0.8 microns wide) is found in the blood under a microscope, this will mean only one thing: the patient has sepsis, infection blood. And he should lie horizontally with a temperature of under 40 and other signs of a serious condition. Because normally blood is sterile. This is one of the main biological constants, which is checked quite simply by inoculating blood on various nutrient media.
They may also tell you that the blood is “acidified.” A shift in the pH (acidity) of the blood, called acidosis, does occur in many diseases. But no one has yet learned how to measure acidity by eye; you need contact between the sensor and the liquid being tested. They can detect “toxins” and tell you about the degree of slagging in the body according to WHO (World Health Organization). But if you look through the documents on the official website of this organization, there is not a word about either slags or the degree of slagging. Diagnoses may include dehydration syndrome, intoxication syndrome, signs of fermentopathy, signs of dysbacteriosis and a host of others that are not related either to medicine or to this particular patient.
The apotheosis of diagnosis, of course, is the prescription of treatment. By a strange coincidence, it will be carried out with biologically active food additives. Which, in essence and by law, are not medicines and cannot be treated in principle. Especially such terrible diseases as fungal sepsis. But this does not bother hemoscanners. After all, they will not treat the person, but the very diagnoses that were given to him out of thin air. And with repeated diagnostics, rest assured, the indicators will improve.
What you can't see with a microscope
No matter what the “experts” tell you, using a microscope you cannot see the pH of the blood in a drop of blood taken from your finger; deficiency of enzymes for protein breakdown; level of water-salt metabolism; food mutagenic/teratogenic toxins; damage to red blood cells by kidney toxins/free radicals; parasites, fungi, bacteria, worm eggs, cysts; activity, quantity and quality of immune cells.
Live blood testing originated in the United States in the 1970s. Gradually, the true essence and value of the technique became clear to the medical community and regulatory authorities. Since 2005, a campaign has begun to ban this diagnosis as fraudulent and unrelated to medicine. “The patient is deceived three times. The first time is when a disease that does not exist is diagnosed. The second time is when a long and expensive treatment is prescribed. And the third time is when a repeat study is falsified, which will necessarily indicate either an improvement or a return to normal” (Dr. Stephen Barrett, vice president of the American National Council Against Medical Fraud, scientific consultant to the American Council on Science and Health).
Are bribes smooth?
Proving that you were deceived is almost impossible. Firstly, as already mentioned, not every doctor will be able to suspect forgery in the technique. Secondly, even if the patient goes to a regular diagnostic center and they don’t find anything there, you can, as a last resort, blame everything on the operator who performed the diagnostics. Indeed, the visual assessment of complex images depends entirely on the qualifications and even the physical condition of the person doing the assessment. That is, the method is not reliable, since it directly depends on the human factor. Thirdly, you can always refer to some subtle matters that the patient cannot understand. This is the last frontier where all medical scammers usually face their death.
What do we have in the bottom line? Unprofessional laboratory technicians who pass off random artifacts (maybe even orchestrated) in a drop of blood as terrible diseases. Then they suggest treating them with nutritional supplements. Naturally, all this for money, and quite a lot.
Does this technique have diagnostic value? It has. Undoubtedly. The same as traditional smear microscopy. You can see, for example, sickle cell anemia. Or pernicytosis anemia. Or other really serious illnesses. But, to the great regret of scammers, they are rare. And you can’t sell crushed chalk with ascorbic acid to such patients. They need real treatment.
And so - everything is very simple. We discover a non-existent disease and then successfully cure it. Everyone is happy, especially the citizen over there, who had a fragment of the bell-mosquito’s space communications antenna expelled from his blood... And no one feels sorry for the money that was wasted, or rather, to enrich the swindlers.
However, not everyone. Some defend their rights in all possible instances. The author has at his disposal a copy of a letter from the Office of Roszdravnadzor in the Krasnodar Territory, where victims of hemoscanning “doctors” turned. The patient was diagnosed with a bunch of diseases that were proposed to be treated with no less than a bunch of biologically active food supplements. Based on the results of the inspection, it turned out that the medical institution that carried out the diagnostics violated licensing requirements, did not enter into an agreement for the provision of paid services (the doctor takes money in cash), and the rules for maintaining medical records were violated. Other violations were also identified.
I would like to end the article with a quote from a letter from the Central Office of Roszdravnadzor: “The 'Hemoscanning' technique was not submitted to Roszdravnadzor for consideration and permission to use as a new medical technology and is not permitted for use in medical practice.” Couldn't say it any clearer.
IMPORTANT!
The information in this section cannot be used for self-diagnosis and self-treatment. In case of pain or other exacerbation of the disease, diagnostic tests should be prescribed only by the attending physician. To make a diagnosis and properly prescribe treatment, you should contact your doctor.
Times change
Changes are visible already at the stage of blood sampling: if previously the doctor collected blood in several test tubes with reagents, a glass capillary and made a smear on the glass, now very small volumes are used - from 12 to 150 μl [15] of blood is enough to examine it for all parameters.
Let's take a look into a modern hematology laboratory. Wow! Everything is cluttered with equipment, and the laboratory assistant is nowhere to be seen... Maybe he went off to make himself some coffee? He won't make it in time! The blood test will be ready in a minute, and the device will give the result in the form of a paper tape with numbers and abbreviations, behind which all sorts of parameters are hidden.
Modern hemoanalyzers are divided into several classes, depending on what they can do. Each subsequent class is a new stage of evolution - faster, more accurate, more perfect. The use of a combination of technologies works wonders: if the first analyzers could determine eight blood parameters and did not distinguish between types of leukocytes [16], then the latest devices are able to differentiate up to seven populations of leukocytes [17] and in total examine more than 40 blood characteristics.
As Arthur C. Clarke said, “Any sufficiently advanced technology is indistinguishable from magic.” Indeed, the most detailed results in such a short period of time cannot but surprise. But all magic is based on physical laws. And although names like electrical impedance, light scattering and photometry are a little intimidating at first glance, now we will understand what principles underlie each analysis technology.
Population census
In the middle of the last century, Wallace Coulter made a revolution by patenting the technology of automatic cell counting. One of the leaders in the production of hematology analyzers, the Beckman Coulter company, is named after him [18]. The aperture-impedance method (or Coulter method) is based on the registration and analysis of impulses that occur when a cell passes through an aperture from one container to another, each of which contains an electrode. When there is no cell in the hole, current flows freely through the electrolyte between the electrodes under the influence of an electric field. To direct the cells to the aperture, a pump is used that pumps out liquid from one container, and the formed elements rush into it. Passing through the aperture, the cell displaces a volume of electrolyte equal to its volume from one container to another. In this case, a pulsed change in resistance (impedance) occurs - the cell membrane creates an obstacle to the free flow of current. At the same time, the current strength recorded by the meter also changes. The number of generated impulses corresponds to the number of formed elements, and the height of the impulse is proportional to the volume of the cell [19]. Using information about the number and volume of formed elements, the device can calculate hematocrit, the average concentration of hemoglobin in an erythrocyte, the width of the distribution of cells by volume and many other parameters [15].
Divide and rule
Differentiation of leukocytes into populations can be carried out using a Coulter counter, but a problem arises - different types of leukocytes are similar in volume and similar pulse amplitude does not always allow one to accurately determine the cell type. What should I do? To solve this problem, combinations of reagents are selected that change the size of cells to varying degrees so that it becomes possible to separate them [15].
But the most common method of differentiation is flow cytometry [20]. The method works as follows: cells in the flow are alternately irradiated with a laser, and the resulting light scattering and fluorescence signals are recorded by detectors and analyzed. In order to correctly determine membership in a population, several parameters are examined at once. Thus, light scattering at a small angle provides information about the relative size of cells, and light scattering at a right angle allows you to “look” inside the cell and study its internal structure - the presence of granules and the shape of the nucleus. Another parameter - fluorescence - can tell about the number of antigens and their appearance on the surface of cells - this cannot be accurately determined by eye. Unlike manual differentiation methods, not 100–200 cells are analyzed, but tens of thousands per second! And each leukocyte receives an individual approach: hydrodynamic focusing ensures that the cells line up in a row and are irradiated one by one in the flow cell. The result of the count appears on the screen in the form of scatter diagrams, where cells with similar properties form clusters.
Precipitated: 2.0
Modern instruments can measure ESR in two fundamentally different ways. The first is the modified Westergren method. The principle of operation has not changed since your grandmother's time, but due to automation it has become faster and more accurate. The second is measuring the kinetics of erythrocyte aggregation using an optical method [21]. It happens like this: an anticoagulant is added to the blood, the tubes with blood are placed in a rotor, where automatic mixing occurs. After this, the analyzer takes part of the blood into a microcapillary, where it accelerates and abruptly stops (the so-called “stopped stream” method). The stop causes aggregation of red blood cells, and at this moment the optical density of the blood is determined using a photometer - the denser the red blood cells are located, the less light will pass through the sample. The device uses the data obtained and builds a sedimentation curve - its analysis will allow you to present the result in the usual units of ESR measurement [22], [23].
Photo for memory
To determine hemoglobin concentration, the International Committee for Standardization in Hematology recommends the methemoglobin-cyanide method. However, a different test that does not use toxic cyanide is now widely used. Meet the SLS method. It is named after the main reagent - sodium laurithyl sulfate. SLS destroys red blood cell membranes, after which it binds to heme groups and forms stable complex compounds. They are analyzed photometrically - laser light is passed through the blood sample. Complex compounds absorb part of the light, as a result of which the intensity of the output light flux weakens. Attenuation is measured using a photosensor and the resulting data is converted into hemoglobin concentration units [24].
Leukocyte formula is the percentage of various forms of leukocytes in the blood serum and the calculation of their number per unit volume. If atypical forms of cells are present, the blood is examined under a microscope. Unlike red blood cells, the population of which is homogeneous, leukocytes are divided into 5 types, differing in appearance and functions: neutrophils, lymphocytes, monocytes, eosinophils, basophils.
Synonyms Russian
The ratio of different forms of leukocytes in the blood, differentiated leukocyte count, leukocytogram, leukogram, blood formula, leukocyte formula count.
English synonyms
Leukocyte differential count, Peripheral differential, WBC differential.
Research method
Flow cytometry.
Units
*10^9/l (10 in st. 9/l).
What biomaterial can be used for research?
Venous, capillary blood.
How to properly prepare for research?
- Eliminate alcohol from your diet the day before donating blood.
- Do not eat food 2-3 hours before the test (you can drink clean still water).
- Avoid physical and emotional stress and do not smoke 30 minutes before the test.
General information about the study
White blood cells, like other blood cells, are produced in the bone marrow. Their main function is to fight infection and respond to tissue damage.
Unlike red blood cells, the population of which is homogeneous, leukocytes are divided into 5 types, differing in appearance and functions: neutrophils, lymphocytes, monocytes, eosinophils, basophils.
White blood cells are formed from stem cells in the bone marrow. They do not live long, so they are constantly renewed. White blood cell production in the bone marrow increases in response to any tissue damage, as part of the normal inflammatory response. Different types of leukocytes have slightly different functions, but they are capable of coordinated interactions by “communicating” using certain substances - cytokines.
For a long time, the leukocyte formula was calculated manually, but modern analyzers make it possible to carry out the study much more accurately in automatic mode (the doctor looks at 100-200 cells, the analyzer looks at several thousand). If the analyzer detects atypical forms of cells or detects significant deviations from reference values, then the leukocyte formula is supplemented by a microscopic examination of a blood smear, which makes it possible to diagnose certain diseases, such as, for example, infectious mononucleosis, determine the severity of the infectious process, and describe the type of atypical cells identified in leukemia .
Neutrophils, the most numerous of the white blood cells, are the first to fight infection and are the first to appear at the site of tissue damage. Neutrophils have a nucleus divided into several segments, which is why they are also called segmented neutrophils or polymorphonuclear leukocytes. These names, however, refer only to mature neutrophils. Maturing forms (young, rod-nucleated) contain a solid core.
At the site of infection, neutrophils surround bacteria and eliminate them by phagocytosis.
Lymphocytes are one of the most important parts of the immune system; they are of great importance in destroying viruses and fighting chronic infection. There are two types of lymphocytes - T and B (the leukocyte formula does not count the types of leukocytes separately). B-lymphocytes produce antibodies - special proteins that bind to foreign proteins (antigens) found on the surface of viruses, bacteria, fungi, and protozoa. Surrounded by antibodies, cells containing antigens are accessible to neutrophils and monocytes, which kill them. T lymphocytes are able to destroy infected cells and prevent the spread of infection. They also recognize and destroy cancer cells.
There are not very many monocytes in the body, but they perform an extremely important function. After a short circulation in the bloodstream (20-40 hours), they move into tissues, where they turn into macrophages. Macrophages are capable of destroying cells, just like neutrophils, and keeping foreign proteins on their surface, to which lymphocytes react. They play a role in maintaining inflammation in some chronic inflammatory diseases such as rheumatoid arthritis.
There are small amounts of eosinophils in the blood; they are also capable of phagocytosis, but they mainly play a different role - they fight parasites, and also take an active part in allergic reactions.
There are also few basophils in the blood. They travel to tissues where they become mast cells. When they are activated, they release histamine, which causes allergy symptoms (itching, burning, redness).
What is the research used for?
- To assess the body's ability to resist infection.
- To determine the severity of allergies, as well as the presence of parasites in the body.
- To identify the adverse effects of certain medications.
- To assess the immune response to viral infections.
- For differential diagnosis of leukemia and to assess the effectiveness of their treatment.
- To monitor the effects of chemotherapy on the body.
When is the study scheduled?
- Together with a general blood test during routine medical examinations and preparation for surgery.
- In case of an infectious disease (or suspicion of it).
- If there is a suspicion of inflammation, an allergic disease or parasite infection.
- When prescribing certain medications.
- For leukemia.
- When monitoring various diseases.
What do the results mean?
The leukocyte formula is usually interpreted depending on the total number of leukocytes. If it deviates from the norm, then focusing on the percentage of cells in the leukocyte formula can lead to erroneous conclusions. In these situations, the assessment is made based on the absolute number of each type of cell (in a liter - 1012 / l - or microliter - 109 / l). An increase or decrease in the number of any cell population is referred to as “neutrophilia” and “neutropenia”, “lymphocytosis” and “lymphopenia”, “monocytosis” and “monocytopenia”, etc.
Reference values
Leukocytes
| Age | Reference values |
| Less than 1 year | 6 - 17.5 *10^9/l |
| 1-2 years | 6 - 17 *10^9/l |
| 2-4 years | 5.5 - 15.5 *10^9/l |
| 4-6 years | 5 - 14.5 *10^9/l |
| 6-10 years | 4.5 - 13.5 *10^9/l |
| 10-16 years | 4.5 - 13 *10^9/l |
| More than 16 years | 4 - 10 *10^9/l |
Neutrophils
| Age | Reference values |
| Less than 1 year | 1.5 - 8.5 *10^9/l |
| 1-2 years | 1.5 - 8.5 *10^9/l |
| 2-4 years | 1.5 - 8.5 *10^9/l |
| 4-6 years | 1.5 - 8 *10^9/l |
| 6-8 years | 1.5 - 8 *10^9/l |
| 8-10 years | 1.8 - 8 *10^9/l |
| 10-16 years | 1.8 - 8 *10^9/l |
| More than 16 years | 1.8 - 7.7 *10^9/l |
Neutrophils, %
| Age | Reference values |
| Less than 1 year | 16 — 45 % |
| 1-2 years | 28 — 48 % |
| 2-4 years | 32 — 55 % |
| 4-6 years | 32 — 58 % |
| 6-8 years | 38 — 60 % |
| 8-10 years | 41 — 60 % |
| 10-16 years | 43 — 60 % |
| More than 16 years | 47 — 72 % |
Most often, the level of neutrophils is elevated during acute bacterial and fungal infections. Sometimes, in response to infection, the production of neutrophils increases so significantly that immature forms of neutrophils enter the bloodstream, and the number of band neutrophils increases. This is called a shift of the leukocyte formula to the left and indicates the activity of the bone marrow response to infection. There is also a shift in the leukocyte formula to the right, when the number of band forms decreases and the number of segmented forms increases. This happens with megaloblastic anemia, liver and kidney diseases.
Other causes of increased neutrophil levels:
- systemic inflammatory diseases, pancreatitis, myocardial infarction, burns (as a reaction to tissue damage),
- oncological diseases of the bone marrow.
The number of neutrophils may decrease with:
- massive bacterial infections and sepsis, in cases where the bone marrow does not have time to reproduce enough neutrophils,
- viral infections (flu, measles, hepatitis B),
- aplastic anemia (a condition in which bone marrow function is inhibited), B12-deficiency anemia,
- oncological diseases of the bone marrow and metastases of other tumors to the bone marrow.
Lymphocytes
| Age | Reference values |
| Less than 1 year | 2 - 11 *10^9/l |
| 1 - 2 years | 3 - 9.5 *10^9/l |
| 24 years | 2 - 8.0 *10^9/l |
| 4 – 6 years | 1.5 - 7 *10^9/l |
| 6 - 8 years | 1.5 - 6.8 *10^9/l |
| 8 – 10 years | 1.5 - 6.5 *10^9/l |
| 10 – 16 years | 1.2 - 5.2 *10^9/l |
| More than 16 years | 1 - 4.8 *10^9/l |
Lymphocytes, %
| Age | Reference values |
| Less than 1 year | 45 — 75 % |
| 1-2 years | 37 — 60 % |
| 2-4 years | 33 — 55 % |
| 4-6 years | 33 — 50 % |
| 6-8 years | 30 — 50 % |
| 8-10 years | 30 — 46 % |
| 10-16 years | 30 — 45 % |
| More than 16 years | 19 — 37 % |
Causes of elevated lymphocyte levels:
- infectious mononucleosis and other viral infections (cytomegalovirus, rubella, chicken pox, toxoplasmosis),
- some bacterial infections (tuberculosis, whooping cough),
- oncological diseases of the bone marrow (chronic lymphocytic leukemia) and lymph nodes (non-Hodgkin lymphoma).
Reasons for decreased lymphocyte levels:
- acute bacterial infections,
- flu,
- aplastic anemia,
- taking prednisolone,
- AIDS,
- systemic lupus erythematosus,
- some congenital diseases of newborns (DiGeorge syndrome).
Monocytes
| Age | Reference values |
| Less than 1 year | 0.05 - 1.1 *10^9/l |
| 1 - 2 years | 0.05 - 0.6 *10^9/l |
| 24 years | 0.05 - 0.5 *10^9/l |
| 4 – 16 years | 0.05 - 0.4 *10^9/l |
| More than 16 years | 0.05 - 0.82 *10^9/l |
Monocytes, %
| Age | Reference values |
| Less than 1 year | 4 — 10 % |
| 1 - 2 years | 3 — 10 % |
| More than 2 years | 3 — 12 % |
Reasons for increased monocyte levels:
- acute bacterial infections,
- tuberculosis,
- subacute bacterial endocarditis,
- syphilis,
- oncological diseases of the bone marrow and lymph nodes,
- cancer of the stomach, breast, ovaries,
- connective tissue diseases,
- sarcoidosis
Reasons for decreased monocyte levels:
- aplastic anemia,
- treatment with prednisone.
Eosinophils
| Age | Reference values |
| Less than 1 year | 0.05 - 0.4 *10^9/l |
| 1-6 years | 0.02 - 0.3 *10^9/l |
| More than 6 years | 0.02 - 0.5 *10^9/l |
Eosinophils, %
| Age | Reference values |
| Less than 1 year | 1 — 6 % |
| 1 - 2 years | 1 — 7 % |
| 24 years | 1 — 6 % |
| More than 4 years | 1 — 5 % |
The most common causes of elevated eosinophil levels are:
- allergic diseases (bronchial asthma, hay fever, food allergies, eczema),
- infection by parasitic worms,
- allergic reaction to medications (antibiotics, allopurinol, heparin, propranolol, etc.).
More rare reasons for their increase:
- Lefler syndrome,
- hypereosinophilic syndrome,
- systemic connective tissue diseases,
- oncological diseases of the bone marrow and lymph nodes.
The number of eosinophils may decrease with:
- acute bacterial infections,
- Cushing's syndrome,
- Goodpasture's syndrome
- taking prednisolone.
Basophils: 0 - 0.08 *10^9/l.
Basophils,%: 0 - 1.2%.
An increase in the content of basophils is rare: with cancer of the bone marrow and lymph nodes, polycythemia vera, and allergic diseases.
The number of basophils may decrease during the acute phase of infection, hyperthyroidism, or long-term therapy with corticosteroids (prednisolone).
What can and cannot be learned from a drop of blood
Just type “diagnosis by a drop of blood” into a search engine and a lot of contradictory information will pop up. It turns out that with a drop of blood you can know yourself from head to toe: find out your genetic profile, predisposition to certain diseases, get your psychological portrait, find out about compatibility with your partner and get a life expectancy forecast. How to distinguish bogus studies from real ones? What can you tell from a drop of blood?
General blood analysis
Once blood was first put under a microscope and found to be made up of cells, scientists realized it could be used for diagnosis. A general (aka hematological) blood test is based on cellular analysis.
A general blood test is:
- cell count (how many leukocytes, red blood cells, neutrophils, platelets, etc.);
- cell differentiation (percentage ratio of cells of one type to cells of another type). This allows us to make assumptions about the processes occurring in the body: for example, viral infection, the effect of toxic substances;
- assessment of cell quality (cell and nucleus size, maturity, saturation of red blood cells with hemoglobin, etc.).
The paradox is that there is not a single diagnosis that could be based solely on a general blood test. But at the same time, a hematological analysis gives a picture of the blood, without which it is impossible to carry out diagnostics.
Everything except cells
Blood is made up of cells and a liquid part (called plasma or serum, depending on whether it contains fibrin, which is responsible for blood clotting, or not).
Diagnostics using plasma or serum is the area that is currently developing the fastest in the world: there are about 1000 types of tests: biochemical, immunochemical, diagnostics for infections. Plasma is a molecular mirror of all our organs and tissues, a marker of all diseases and infectious processes.
Wait for an immune response. Many types of serum diagnostics are based on the principle of an immune response: any bacteria, any virus that invades our body leaves a trace in the blood in the form of a response from the immune system, regardless of whether we are sick or not. By doing a blood test, we can find out whether our immune system is familiar with this pathological agent (accordingly, whether immunity has already been developed or not).
Using the principle of the immune response, you can study a huge number of parameters: find out what causes your allergies, identify oncology, hormonal disorders, cardiovascular diseases, brain tissue disorders and much more.
It's all biochemistry. Cholesterol, bilirubin, blood enzymes, albumin and globulins are all the subject of a biochemical blood test. Using biochemical indicators, you can evaluate the functioning of the main organs and systems (liver, kidneys, protein metabolism), obtain information about metabolism (lipid and carbohydrate metabolism), and determine the need for minerals.
Deep into the core
Relatively recently emerging diagnostic methods involve the study of cell nuclei and DNA fragments.
PCR diagnostics . This is a method that allows you to detect even small concentrations of certain DNA fragments, achieving a significant increase in their concentration in the sample. Using the PCR method and other DNA methods, it is possible, for example, to find the immunodeficiency virus and hepatitis in the blood and confirm the fact of infection.
Bacteriological research . Allows you to isolate pathogens from biological materials. “Knowing the enemy by sight” is necessary in order to test him for sensitivity to antibiotics and select therapy that will be effective for a particular patient.
When tests are unnecessary
Tests may be unnecessary for two reasons: due to the patient’s excessive curiosity and due to the doctor’s insufficient qualifications.
With a curious patient, everything is clear: in principle, an analysis for something new and interesting can be done at least every day - fortunately, now there is a great variety of markers, and new ones appear almost every day.
The situation is different with the doctor’s qualifications. Indeed, an indifferent doctor may say: “Get tested for all infections.” If we take his words literally, we will have to take tests for more than 200 infections, including such exotic ones as borelliosis and malaria. Hence the conclusion: a good specialist will not direct the patient to donate blood for “all infections” or “all allergens.” But a competent patient will not go, if only because this frontal approach will cost him several salaries.
Blood diagnostics is an area in which the desire to find out “everything at once” can turn out to be either ruinous or too labor-intensive. Therefore, there is a rule: it is necessary to do screenings that can tell us something specific, and then, if necessary, expand the boundaries of the study. In other words, there is no point in making insulin antibodies without measuring glucose levels.
Diagnostic skill
Any ultra-modern equipment, any supernova markers are just tools that are just an addition to the clinician’s head. To the very head that makes decisions: what studies to order and how to interpret the information received. This will require experience, flair, and talent as a diagnostician.
The doctor finds himself caught between two fires: on the one hand, there is nothing sadder than missing a disease and not prescribing additional screening. On the other hand, it is no less sad for a doctor to rely on his experience and not double-check his assumption. For example, after a single determination of antibodies to infectious agents, a diagnosis should not be made: this is always the subject of repeated research, comparison of the results obtained over time and the intellectual work of the clinician.
The doctor’s experience is also useful in less critical cases - for example, when the patient is not worried about anything and he wants to “just get checked”: a preliminary consultation with a specialist will be useful. Word from Lyubov Stankevich:
“For example, in front of me is a 16-year-old boy. Most likely, he will not need a tumor marker if nothing bothers him. It is also not worth asking for an extended lipid profile unless the young person is obese and unless I suspect he has a metabolic disorder. Hematological blood test, standard biochemistry, urinalysis - that's what I can prescribe for him. This is the minimum that will never really hurt anyone.”
Not everything can be learned from a drop of blood.
But this is all medicine. People want to use the capabilities of blood testing for simpler, everyday tasks, if possible not related to diseases. The advertisement meets these popular aspirations and offers: diets based on blood type, find out your life expectancy based on a blood test, get to know yourself and find out what the blood type of your other half should be so that you live happily ever after.
How can we understand when the technique works and when our brother is being fooled - especially if something new is constantly appearing in blood diagnostics?
Lyubov Stankevich, medical director of the Ditrix Medical laboratory, says:
“First of all, any theory must be supported by practical developments. For example, there is a theory that each blood group has its own diet; they even try to base this on an evolutionary genetic theory: the first group are hunters, the second are gatherers, and so on. But where is the scientific experimental confirmation of these considerations in the conditions of the modern world?
We may notice some fact. For example, in Japan, when applying for a job, you must indicate your blood type: on this basis, the employer makes conclusions about the employee’s character. Suppose there is such a connection: but have we interpreted the observed fact correctly? This can only be understood after many years of observation. Therefore, any technique has an important criterion: data obtained in one laboratory must be reproducible in another with exactly the same results. If a technique is not reproducible, such a technique is worthless.”
Thank you for your consultation
Medical Director of the Ditrix Medical laboratory Lyubov Stankevich
Helpful information
T. Shuzel
A simple blood smear test provides accurate and quick information. Additional quantitative counting of blood cells is provided using a hematological automatic counter.
Blood smears are used to count and evaluate different morphological forms of blood cells. It should be borne in mind that complete information cannot be obtained only using automatic meters.
This article describes methods for preparing and analyzing blood smears, as well as obtaining additional information through the use of automatic research methods.
TECHNIQUES FOR PERFORMING BLOOD Smears
There are many indications for blood tests, and they are aimed not only at diagnosing anemia. Most systemic diseases also lead to changes in the hemogram, the analysis of which is the basis for diagnosis.
1. Taking material for research
Most often, a blood smear is performed by applying a drop of venous blood taken from a tube preserved with ethylenediaminetetraacetate (EDTA) onto a glass slide, which preserves the morphology of the cells. The percentage of blood/anticoagulant must be observed: excess EDTA causes pseudothrombopenia artifact and changes cell morphology (serrated edge of red blood cells).
The material is applied to a glass slide immediately after collection, because cell damage occurs during storage (vacuolation of leukocytes, nuclear pyknosis1).
1 Pyknosis (gr. puknosis, condensation) [English. pyknosis]. Transformation of the nucleus in a cell with chromatin condensation. The nucleus becomes homogeneous and has a uniform color. The manifestation of this phenomenon is associated with cell death.
2. Method of applying the material
- A drop of blood is applied to the surface of a glass slide, positioned horizontally, using a pipette close to its edge (photo 1).
Photo 1. Performing a blood smear: Place one drop of blood on the end of a slide. Another glass, with which you need to make a smear, is placed on the slide in front of the drop of blood at an angle of approximately 30-45° (photo 2). By sliding it along the slide, it is brought closer to the drop of blood until the latter is distributed along the moving edge (photo 3). After this, the glass is moved with a one-way movement along the surface of the glass slide towards the opposite edge. The slide is marked before or after application of the material, which avoids possible errors.
| Photo 2. Performing a blood smear: a glass for performing a blood smear is placed on a glass slide with a drop of blood at an angle of 30-45°. | Photo 3. Performing a blood smear: the slide is moved close to the drop of blood until it begins to distribute along the entire front of its edge due to capillarity. |
- The purpose of applying the material to a glass slide is to obtain a homogeneous smear with a thinning end (tails, also called pigtails). In this thin part of the smear, blood cells are arranged in one layer, which allows you to examine their morphology (photo 4). Figure 1 shows how a blood smear should be performed.
| Photo 4. Performing a blood smear: the blood smear has a homogeneous structure with a cellular thinned monolayer located in the part of the slide opposite to the drop of blood applied to it. | Fig.1. Picture of a smear after applying the material to a glass slide |
- If cell counting cannot be performed immediately on site, the resulting smears, delivered with the rest of the material to the laboratory, are not stained.
- Before staining, smears must be dried in fresh air, avoiding high temperatures, because this can lead to artifacts due to deformation of the surface of red blood cells.
These precautions are extremely important because when animals with erythrocyte invasion are infected with rickettsia (Hemobartonella felis) and piroplasmas (Babesia canis), artifacts arising from staining smears can make identification of the pathogens difficult. Using the May-Grunwald-Giemsa dye (Pappenheim method), a very high-quality microscopic picture of the smear is obtained with detail of the nuclear and cytoplasmic apparatus of the cell (Appendix 1). It should be noted that this painting method takes a long time (more than 20 minutes). In addition, rapid rinsing may damage the test material. But quick staining of smears (Diff-Quik, RAL) in emergency cases allows you to obtain the necessary analysis results in a short period of time. The main disadvantage of using quick sets (Kits) is that they do not allow sufficient detailing of the nuances inside the cell itself (the genesis of chromatin artifacts, qualitative assessment of the cytoplasmic state).
Appendix 1. Painting scheme according to May-Grunwald-Giemsa
Classic paint scheme
— Place the slide with the material applied on it into the May-Grunwald stain and leave for 4 minutes. — Place the slide with the material applied to it in May-Grunwald paint, diluted by 50% with water, and leave for 2 minutes. — Rinse the slide with distilled water. — Place the slide in a container with a 5% solution of Giemsa paint diluted with tap water and leave for 15 minutes. — Rinse the slide and dry.
Simplified diagram
— MayGrunwald-Giemsa stain (2-3 ml) is poured onto the smear, while the slide should be placed horizontally in the supporting device. Coloring is carried out within 5 minutes. — Carefully drain off the dye and reapply the Giemsa dye solution diluted 1:10 with water extemporaneously for 10 minutes. — Rinse the slide and dry.
ARTIFACTS
- Artifacts that can occur due to very rapid or insufficient drying, as well as due to high temperature or excess EDTA, have the following manifestations:
- jagged forms of erythrocytes or echinocytosis (must be differentiated from acanthocytosis2); - refraction of light under a microscope in bodies located on red blood cells (must be differentiated from piroplasmas or babesias) (photo 5).
2 Acanthocytosis (Gr. akanta, thorn, needle; kutos, cell) [English. akanthocytosis]. Deformation of red blood cells that resembles a hedgehog's spine.
| Photo 5. Artifact from improper drying of red blood cells: light-refracting bodies located on the surface of red blood cells. Activated lymphocyte. |
Artifacts resulting from painting due to the use of an old dye solution or improper painting conditions (insufficient soaking time):
— weak coloring of cells, mainly the nuclear apparatus; — dye depot (photo 6); — pseudo-inclusions (superposition of two elements).
| Photo 6. Coloring artifact: dye depot. |
READING METHOD
Blood smear analysis is always carried out in the same way, following the appropriate steps.
The collection of information begins from the moment the material is applied to a glass slide, before the study of blood cells under immersion.
1. Macroscopic examination
- Interpretation of the blood smear begins by examining it with the naked eye immediately after applying the blood to the slide. At this stage, the quality of the resulting blood smear is assessed (the thinness of the end of the smear and homogeneity, the presence of agglutination of a drop of blood).
- The presence of macroscopic agglutination before drying and staining is characterized by heterogeneous distribution of blood on the slide in the form of “dot clots”, which indicates autoagglutination or the presence of erythrocyte columns (photo 7).
| Photo 7. Macroscopic agglutination. Attention should be paid to the lack of homogeneity of the blood. This agglutination is caused by autoagglutination or persistence of erythrocyte (coin) columns. |
- In dogs, autoagglutination occurs due to sensitization of red blood cells by antibodies. This is serious evidence of hemolytic processes of an immune nature, while the presence of the formation of coin (erythrocyte) columns mainly occurs in the case of dysproteinemia. To distinguish between these two phenomena, a drop of blood is mixed with saline solution. This causes the agglutination to disappear if a coin column is formed. The persistence of this blood condition indicates autoagglutination.
- Macroscopic agglutination in a cat, manifested by a accumulation of red blood cells, is nonspecific and cannot be interpreted.
Then the slide with the blood smear applied on it is dried, stained and examined under a microscope.
2. Examination of a smear under low magnification
The first stage of microscopic examination of the material is carried out at low magnification (×10 or ×20 objective). This allows you to assess the quality of the smear and obtain the first information.
In the area of the thinnest part of the smear, a large accumulation of leukocytes is noted, which makes it possible to determine their number already at the first assessment (photo 8).
| Photo 8. Examination of the pigtail of the blood smear at low magnification. Red blood cell counting is possible. This image shows pronounced leukocytosis with a predominance of neutrophils. | Photo 9. Examination of the smear at low magnification: an accumulation of platelets is observed. |
Detection of platelet accumulations (Figure 9) indicates an artifact that may lead to a false conclusion of thrombocytopenia.
- At the level of the monocellular layer, a complete visual examination of the slide at low magnification (×40) allows one to calculate the leukocyte formula.
- It is recommended to search for nucleated red blood cells. If we find them in large quantities, then this indicates a violation (we may be talking about the circulation of microfilariae, or we are dealing with abnormal cells). The researcher always focuses his attention on the suspected presence of macroscopic agglutination of red blood cells (photo 10) or the formation of coin columns (photo 11).
- The various cells are then examined under high magnification.
| Photo 10. Examination of the cellular monolayer (×40): microscopic autoagglutination. | Photo 11. Study of the cellular monolayer (×40): erythrocyte columns. |
ASSESSMENT OF THE CONDITION OF RED CYTES
- The condition of red blood cells is assessed under immersion (×100) in the middle part of the smear: in the monocellular layer, where they are well separated and not deformed.
- Morphological assessment reveals symptoms of medullary regeneration, as well as changes in size, shape and the presence of inclusions.
- Normal red blood cells in domestic carnivores are round, anucleate cells in the shape of a biconcave disk (discocyte), the diameter of which is approximately 7 μm in a dog and 6 μm in a cat. In the monocellular zone they are represented by a monocellular layer, have a round shape with a pale glow in the center (practically absent in cats), and are colored yellow-orange (moderate eosinophilia). In this case, physiologically moderate anisocytosis3 can be observed (photo 12).
| Photo 12. Red blood cells and normal platelets in a dog. |
3 Anisocytosis (gr. an, negative prefix; isos, equal; kutos, cell) [English. anisocytosis]. The pathological state of red blood cells, when they vary greatly, while normally they should be the same. This term is also acceptable in relation to variations in leukocyte diameter.
1. Signs of regeneration
- The information obtained from the blood test does not indicate the cause of the anemia or its regenerative nature. But it allows you to assess the severity of disorders by counting the number of red blood cells, determining the concentration of hemoglobin and hematocrit.
Examination of blood smears of an animal suffering from anemia, in combination with hematological analysis performed using automated technology, allows us to assess the degree of regeneration and, in some cases, identify the cause of anemia.
- Pathognomonic symptoms of regeneration in blood smears are as follows: polychromatophilia; anisocytosis; Havel-Joly bodies; erythroblasts (red blood cells containing a nucleus) associated with reticulocytosis observed with special staining.
- Polychromatophilia (photo 13) is determined by the presence in the blood of large-diameter red blood cells of a violet color with elements of basophilia, which contrast with the orange color of normal red blood cells. These polychromatophilic cells correspond to immature forms of red blood cells that are widely distributed in the bone marrow and are seen in degenerative bone marrow changes. In the cytoplasm they contain remnants of ribosomal RNA, which gives a purple color. This corresponds to reticulocytes with intravital coloring (shimmering cresyl blue) in dogs and cats.
| Photo 13. Examination of the monocellular layer in a smear with high magnification (×100). It should be noted the presence of polychromatophilic erythrocytes, anisocytosis of erythrocytes and the presence of spherocytes. The erythroblast is observed at the lower left. | Photo 14. Examination of the monocellular layer at high magnification (×100). You should pay attention to erythrocyte anisocytosis and small azurophilic inclusions of a round shape, which are contained in some erythrocytes: Havel-Joly bodies. |
- Anisocytosis (photo 14) - variations in the size of red blood cells. The number of large red blood cells in the blood increases. Polychromatophily is associated with large size and corresponds to anisocytosis. The presence of red blood cells with more intense color and larger red blood cell size is a strong argument in favor of regenerative anemia.
- Erythroblasts (nucleated red blood cells, immature forms), usually found in the bone marrow, tend to sometimes appear in small numbers in the circulating blood of a healthy body.
They are characterized by their large size, have a grayish-violet cytoplasm, and a voluminous, round, intensely colored nucleus. Their number increases with regenerative anemia, but the presence of these cells alone does not allow making a diagnosis of the suspected disease. Erythroblasts can be observed in large numbers in the circulating blood during lead poisoning, severe septicemia, and various blood diseases (myeloproliferation syndrome, etc.).
- To confirm regenerative anemia, it is necessary to count reticulocytes circulating in the blood after staining with blue brilliant cresyl (Appendix 2). When carrying out this staining, mature forms of erythrocytes with blue intense staining of the cytoplasmic reticulum are distinguished. In a dog, all cells with this color are counted, whereas in a cat, only reticular erythroblasts are counted (recognized due to the pronounced accumulation of cytoplasmic granulation).
Appendix 2. Methods for determining the number of reticulocytes
Method Execution
- Mix 500 µl of blood with 500 µl of blue brilliant cresyl solution (1 g of brilliant blue cresyl powder and 0.4 g of citrate, diluted in 100 ml of isotonic solution). - Leave for 10-20 minutes at room temperature. — Apply this mixture to a glass slide, as is done for obtaining a blood smear. — Count the number of observed reticulocytes at high magnification (approximately to visualize 100 red blood cells in the field of view of the microscope under immersion) and carry out this procedure in 10 objective fields. The resulting amount is expressed as the percentage of circulating reticulocytes. The relative estimate is transformed into an absolute value by multiplying this number by the total number of red blood cells.
Interpretation
Some authors talk about bone marrow regeneration at a quantitative rate of 80,000-30,000 reticulocytes per mm3 in dogs and cats. Others talk about 0 reticulocytes in mm3. If the assessment is questionable, or one indicating the lower limit of the norm, a repeat count is carried out after two or three days. Reticulocyte kinetics facilitates more accurate interpretation.
Havel-Joly bodies (photo 14) are single inclusions of small size, have an azurophilic and round shape, and are present in young red blood cells that are in the maturation phase. They belong to the nuclear material phase of erythroblasts and are eliminated upon maturation. A small percentage (less than 1%) may be present in cats under normal physiological conditions. Their number increases with regenerative anemia, splenectomy, and in animals treated with glucocorticosteroids and chemotherapy drugs.
2. Size anomalies
- Spherocytosis is the most common abnormality of red blood cell size. It indicates an immunological effect on red blood cells during the development of hemolytic anemia. The presence of spherocytes is explained by partial lysis of erythrocytes coated with antibodies by macrophages of the liver and spleen. Spherocytes are recognized by their small size, have a homogeneous cytoplasm and intense coloring, they do not have a pale spot in the center. These cells are more difficult to identify in a cat: healthy red blood cells in this species do not have a pale color in the center.
In immunoglobulin-mediated hemolytic anemia, smears indicate a pronounced concentration of spherocytes, which is associated with signs of bone marrow regeneration (the presence of polychromatophils, Havel-Joly bodies and anisocytosis).
- Symptoms of medullary regeneration with the presence of large (macrocytes) or small (microcytes) red blood cells can be observed in the circulating blood. These cells have the tinctorial and morphological properties of normal red blood cells. It is much more difficult to detect an abnormality: it is necessary to estimate the mean volume of red blood cells (VGM) using an automatic counter.
Causes of decreased VGM may include portosystemic shunting or regenerative anemia caused by iron deficiency. An abnormal size is an early sign of sideropenia (low iron). Hypochromasia (reduced coloration) manifests itself much later and occurs several months after the onset of the disease.
- Some individuals belonging to certain breeds of dogs (for example, the poodle) have a VGM that exceeds the norm. Such macrocytes are sometimes detected in blood smears.
3. Shape anomalies
- Dog and cat red blood cells circulating in the blood are usually round in shape. An increased content of red blood cells of various forms is called poikilocytosis (photo 15). This nonspecific term refers to variations in the shape of red blood cells in relation to the physiological norm, without indicating the nature or severity of the abnormalities. This anomaly is considered an artifact or is associated with a variety of systemic diseases.
| Photo 15. Examination of the monocellular layer at high magnification (×100). Note the varying shapes of red blood cells (erythrocyte poikilocytosis) and large platelets (macroplatelet). |
- Many terms, some of which are intended to describe the cytological picture, are used to describe the form of red blood cell abnormalities: codocytes, dacryocytes, keratocytes, stomatocytes, and so on. The presence of individual forms is a pathognomonic sign of certain disorders and correlates with the clinical picture of the disease. With the development of poikilocytosis, one should mainly look for severe disorders associated with the inflammatory process or pathology of the hepatobiliary system.
- With metabolic disorders, red blood cells can be deformed due to an abnormality in their membrane. Acanthocytes are deformed red blood cells whose elongated shape resembles a finger. They are formed due to membrane abnormalities caused by liver disorders (bypass surgery, liver neoplasms, lipoproteinopathy, hypercholesterolemia).
- Mechanical fragmentation of erythrocytes during hemocirculation disorders leads to the formation of schizocytes: these are fragments of erythrocytes of various sizes that may have an irregular shape (dots, sickle, etc.). They occur due to blood turbulence, for example, with valve stenosis. Schizocytes are characteristic of caval syndrome. This is a pronounced hemolytic crisis in individuals that are carriers of various parasites, for example adult forms of Dirofilaria immitis. They persist in the caudal vena cava and cause secondary rheological blood disorders. Also, mechanical fragmentation of erythrocytes can be caused by immunological or physical aggressions (DIC, hemangiosarcoma, severe inflammation, etc.).
4. Color abnormalities
The color intensity of red blood cells is proportional to the concentration of hemoglobin they contain.
- Hypochromia (photo 16) is determined by the presence of pallor in the central part of the red blood cell due to a pronounced decrease in hemoglobin content. Often detected in sideropenic anemia. Hemoglobin is concentrated in a thin peripheral ring in red blood cells called annulocites.
| Photo 16. Examination of the monocellular layer at high magnification (×100). It should be noted the presence of annullocytes: red blood cells have a pronounced clearing in the center due to the reduced hemoglobin content. |
Most of these anemias are associated with iron deficiency due to chronic loss in the digestive system (ulcers, collapsing tumors, etc.).
- On the contrary, a certain degree of hyperchromia (optical) can be detected in hemolytic anemia by the presence of spherocytes, uniform erythrocytes with intense coloring.
5. Presence of inclusions
Typically, red blood cells have a uniform (homogeneous) color without any inclusions. A large number of erythrocyte inclusions have been identified in dogs and cats, some of which are present normally.
- Heinz bodies appear as fawn-colored protuberances on the membrane or inside red blood cells, caused by the oxidation of hemoglobin molecules. They are much easier to identify using special stains (methylene blue, cresyl blue brilliant), but they can be observed with regular stains due to their large size.
- The presence of Heinz bodies is usually observed in felines in small quantities (less than 3%). This is due to the high content of sulfhydryl groups on the hemoglobin molecule and explains the increased sensitivity to oxidation processes. If there are a large number of Heinz bodies in a cat, poisoning with toxic doses of drugs that cause oxidation (paracetamol, consumption of onions), as well as diseases associated with metabolic processes (diabetes, hyperthyroidism), or oncological nature (malignant lymphoma) are assumed primarily. With severe intoxication, oxidized hemoglobin can condense into some red blood cells. The remaining cytoplasm in the optical field appears empty and forms an eccentric cell. Its morphology is similar to Heinz bodies.
- Blood smear examination can identify some pathogens in dogs and cats. The most common are hemobartenellosis (Hemobartonella felis) and piroplasmosis (Babesia canis).
- Hemobartenella have the form of small cocci or rods localized on the surface of the red blood cell membrane, which are sometimes difficult to differentiate from artifacts that arise when preparing a blood smear.
- Pyroplasmas are characterized by pear-shaped basophilic inclusions in the cytoplasm of red blood cells. The double form is classic for the disease, but intra- or extracellular persistence of the four parasites can also be observed in smears.
- Inclusions of viral particles during plague can also be found in red blood cells. They are located in the cytoplasm, have a round shape, blue and pale pink color. They are mainly observed during the acute course of an infectious disease, when the symptoms are of a weakly specific nature. Despite their rare occurrence, these inclusions may be the only indicator when diagnosing a viral disease.
PLATELET STUDY
- Blood platelets, or platelets, have a round or oval shape, a poorly differentiated contour and pink granularity. Their size is smaller than that of red blood cells.
- If accumulations are detected in the blood smear, this indicates artifactual thrombocytopenia during puncture (activation of primary hemostasis, platelet aggregation in the test tube, which excludes the possibility of counting) or excess EDTA.
- The quantitative content of platelets is determined under an immersion lens (Appendix 1). This research method is used in cats. Some machines often make errors due to poor volume differentiation between red blood cells and platelets, which causes inaccurate counting.
- The presence of megathrombocytes (size equal to, sometimes exceeding, the volume of a red blood cell) is often associated with early, as well as secondary regeneration of platelets during their destruction or peripheral disposal. Much less frequently, enlarged platelets can be a consequence of bone marrow dysplasia, where the megakaryocyte cell line is affected (in an infectious disease caused by the feline leukemia virus).
- The presence of microplatelets in blood smears indicates their destruction mediated by an immune reaction (thrombocytopenic purpura of an immune nature). These small platelets are fragments coated with antibodies. They have a meaning similar to spherocytes, which are identified in anemia of an immune nature.
- Inclusions in platelets are rare, but they are detected during infection with Ehrlichia platys (causes cyclic thrombocytopenia).
Appendix 3. Platelet count formula (immersion lens)
Dog: platelets/µl. The number of platelets in the field of view of the microscope is determined (×100, ×15,000).
Cat: platelets/µl. The number of platelets in the field of view of the microscope with magnification (×100, ×20,000) is determined.
A healthy animal has from 8 to 25 platelets, observed at medium magnification in the field of view of the microscope. This count makes it possible to identify thrombocytopenia (less than 3 platelets per field of view) and severe thrombocytosis with high accuracy.
RESEARCH OF LEUKOCYTES
- Leukocyte control is carried out at the first stage of the study using automated counting. This study is carried out in pigtails of a smear at low magnification.
- The density of leukocytes at the end of the smear and in its central part allows you to determine their number, while a differentiated count of 100 or 200 leukocytes allows you to more accurately determine the leukocyte formula of the blood than can currently be done using most machines used for this purpose. Qualitative assessment in visual examination requires the qualifications of the researcher. The number of formed elements and the leukocyte formula calculated in blood smears must correspond to the results of an automatic study.
- Counting the formula or examining the lines of developing leukocytes makes it possible to recognize abnormal or blast cells in the circulating blood in malignant hemopathy. Currently used Coulter-type machines do not allow differentiating normal from abnormal leukocytes. These cells are counted as normal white blood cells and their presence may not be apparent to the clinician (Figure 17).
| Figure 17: Abnormal or blast cells that may not be identified by automated imaging. |
- Next, morphological analysis is performed at a higher magnification (×40 or ×100) in the area of the smear with a monocellular layer where the morphology of the cells is clearly visible. Neutrophil granulocytes (polynuclear neutrophils, PNN) are determined. Lymphocytes and monocytes are present in sufficiently large quantities in the circulating blood, which allows for morphological analysis. In domestic carnivores, the blood formula has a neutrophilic profile. In young individuals, lymphocytes may predominate (observed up to the age of one year).
- The most common modifications are associated with changes in the morphology of polynuclear neutrophils during systemic inflammatory processes or cellular pathology (in the case of sepsis, endotoxemia or severe necrosis). In this case, we are talking about toxic polynuclear neutrophilia. The first stage indicates moderate toxicity and is determined by the detection of Doyle bodies: grayish, irregular inclusions in the cytoplasm that are caused by aggregation of the cytoplasmic reticulum. These difficult-to-detect cytoplasmic inclusions are the earliest indicator. Diffuse cytoplasmic basophilia occurs in more severe cases. With increased toxicity, two listed signs are observed: microvacuolization of the cytoplasm, which has a foam pattern (“soap bubbles”) (photo 18). In critical cases, cellular gigantism is noted. Complete lysis of the nuclear apparatus completes the picture.
| Photo 18. Leukocyte assessment. A polynuclear neutrophil with cytoplasmic microvacuoles in the form of “soap bubbles” is presented: we are talking about a toxic “polynuclear cell”. | Photo 19. Leukocyte assessment. Hypersegmented polynuclears (more than 5 lobes in polynuclears). Examination of these cells mainly indicates the physiological nature of the cell changes (cell aging). |
- Nuclear hypersegmentation (right-sided deviation of the nucleus or Arnett curve) without signs of toxicity is often a morphological change in the neutrophil population (Figure 19). This condition is determined in the population of neutrophil polynuclear cells by pronounced segmentation of the nucleus (more than 5 lobes), which mainly indicates aging of blood cells. Increased contact with EDTA (long-term preservation of blood before performing a smear), corticosteroid therapy with a decrease in tissue circulation, chronic inflammation are the causes of a non-physiological increase in the hypersegmentation of polynuclear neutrophils.
- The stage of incomplete maturation, or “band form” (photo 20), is characterized by incomplete segmentation of nuclei shaped like a horse’s shoe or a groundnut (peanut). The presence of this imperfect stage of cells in large numbers is associated with neutrophilia (deviation of the nucleus or Arnett curve to the left). Indicates an increase in granulopoiesis, often due to an increase in phagocytosis in peripheral tissue, for example, during acute purulent inflammation.
| Photo 20. Assessment of leukocytes. Young neutrophilic polynuclear cell, or “band form”: its nucleus is in a state of hyposegmentation and has the shape of a peanut. Erythrocyte anisocytosis may also be noted. |
- Other groups of leukocytes may also change, which has the following explanation: lymphocytes do not show signs of toxicity, but react when stimulated by an antigen of an infectious agent, as well as during an immune or neoplastic process. These reactive lymphocytes, or “immunocytes,” are characterized by increased size and marked basophilia. Other modifications, such as azurophilic cytoplasmic inclusions, can also be found in lymphocytes called “granular lymphocytes” (Figure 21). They are observed in the circulating blood during nonspecific stimulation of the immune system (viral diseases, recent vaccination), as well as in the case of neoplasms and some chronic disorders (erlichiosis). These activated cells are NK (natural killer) cells.
| Photo 21. Leukocyte assessment. It should be noted the presence of a lymphocyte in a granular state, which contains azurophilic inclusions in the cytoplasm. |
- Leukocyte inclusions are extremely rare. They belong to the morulae of canine ehrlichiosis (Ehrlichia canis) in monocytes and bodies of Lentz in distemper, which are included in lymphocytes, monocytes and neutrophil granulocytes.
- The presence of erythrophagocytes (monocytes that phagocytose red blood cells) can be observed in hemolysis of an immune extracellular nature, for example in babesiosis.
A clinician who has automated blood testing equipment that provides results during the consultation period has great advantages. However, additional blood smear studies are recommended to evaluate and explain systemic abnormalities.
Appendix 4. Basic provisions
Drying of blood smears is carried out in fresh air, without a heat source, which can cause the presence of artifacts that interfere with the assessment of the morphological status of blood cells.
Macroscopic agglutination is physiological in the cat. In the dog, it may correspond to both the formation of coin columns and microscopic agglutination, often occurring in hemolytic anemia.
It is necessary to clarify the presence of thrombocytopenia, determined using an automated study, through careful examination of smears to identify accumulations of platelets responsible for pseudothrombocytopenia.
The presence of polychromatophils, the presence of erythrocyte anisocytosis and Havel-Joly bodies on the blood smear are symptoms of regenerative anemia.
In the case of the presence of an increased content of activated lymphocytes, it is necessary to conduct a systematic search for the persistence of chronic inflammation.
SVM 5/2004