What is electrocardiography
Electrocardiography is a popular method for diagnosing cardiac diseases. It is based on recording and studying the electric fields that arise during the work of the heart muscle. With it you can:
- detect arrhythmia and heart rate disturbances (tachycardia, parasystole) in time;
- diagnose disruptions in the conduction of nerve impulses inside the heart;
- determine acute and chronic changes (myocardial infarction, ischemic heart disease);
- identify acute and chronic lung diseases (thromboembolism, chronic bronchitis);
- diagnose changes in the myocardium - thinning or thickening of the heart muscle;
- suspect myocarditis (dangerous inflammation of the heart muscle).
This is a painless procedure, carried out using sensors that are attached to the chest and limbs. With their help, the bioelectric potentials of the heart are recorded. The result is recorded on a special tape or recorded in a computer. As a result, the patient receives a cardiogram, which is subsequently deciphered by a cardiologist.
What is an ECG, features of its registration, pros and cons of portable devices
We have all heard the abbreviation ECG more than once. Many of us even know how it stands for. Since childhood, we have all been familiar with the not very pleasant feeling of cold and wet electrodes on our chest. And the first thing we are told to do when questions about the heart arise is an electrocardiogram. But questions arise about how accurate this study is, how informative, what it can track, what affects the final result, how to interpret, how often to do it, what are the pros and cons of an ECG.
Optical heart rate sensors are no longer surprising. You can even buy a bracelet for the price of several cups of coffee that will be able to measure your pulse. But recently, more and more devices with ECG measurement function have appeared on the market. What is this, a marketing ploy or a really useful tool?
I will try to answer all these questions today. But let's take things in order.
What is an ECG? Electrocardiography is an accessible and informative technique for studying the functional state of the heart by graphically recording electrical impulses arising during cardiac activity. Electrocardiography is a relatively inexpensive but valuable method of electrophysiological instrumental diagnostics in cardiology. The direct result of electrocardiography is an electrocardiogram (ECG). It is the occurrence of electrical impulses in the heart that causes the rhythmic alternation of contraction (systole) and relaxation (diastole) of the heart muscle over a certain time range.
An electrocardiograph is a special medical device that records impulses coming from sensors mounted on the body and converts them into a graph, i.e. an electrocardiogram, which is subject to further analysis by a cardiologist. Since ECGs are performed in hospitals and at home, there are stationary and portable cardiographs.
In short, the electrocardiograph records the total electrical activity of the heart, or more precisely, the difference in electrical potentials (voltage) between 2 points
The main components of the device are:
- electrodes placed on a person’s arms, legs and torso;
- switch-regulator;
- signal amplifier;
- filter against network interference.
Modern cardiographs have high sensitivity to the bioelectrical activity of the heart muscle and accuracy in transmitting impulse oscillations.
Purpose and objectives of the ECG An electrocardiogram is taken for the correct diagnosis of heart disease. Using this procedure, the following parameters are assessed:
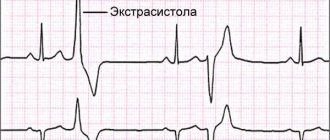
- Determination of frequency (see also pulse) and regularity of heart contractions (for example, extrasystoles (extraordinary contractions), or loss of individual contractions - arrhythmias).
- Indicates acute or chronic myocardial damage (myocardial infarction, myocardial ischemia).
- Can be used to identify metabolic disorders of potassium, calcium, magnesium and other electrolytes.
- Detection of intracardiac conduction disorders (various blockades).
- Screening method for coronary heart disease, including stress tests.
- Gives an idea of the physical condition of the heart (left ventricular hypertrophy).
- May provide information about non-cardiac diseases such as pulmonary embolism.
- Allows you to remotely diagnose acute cardiac pathology (myocardial infarction, myocardial ischemia) using a cardiophone.
- Must be used when undergoing medical examination.
Reasons to undergo an ECG examination is done in the following main cases:
- chronically high blood pressure;
- making a diagnosis for chest pain;
- obesity;
- jumping heart rate;
- monitoring in athletes
Among other things, an ECG can be prescribed in many other cases. An ECG is mandatory before operations, as it is one of the main tests on the basis of which permission to perform surgery is given.
Type of electrocardiogram Graphic recording of an ECG is a broken line, the sharp corners (teeth) of which are located above and below the horizontal line on which time cycles are recorded. The teeth show the depth and frequency of rhythmic changes. An electrocardiogram reflects only electrical processes in the myocardium: depolarization (excitation) and repolarization (restoration) of myocardial cells.
Graphically, the ECG is a sequence of the QPRST complex. Each tooth of which is designated by a corresponding letter, and the intervals between the letters are nothing more than a display of the phases of the heart.
Correlation of ECG intervals with the phases of the cardiac cycle (ventricular systole and diastole)
- *Systole is one of the states of the heart muscle during heartbeat, namely the contraction of the left and right ventricles and the ejection of blood into the aorta from the left ventricle and into the pulmonary trunk from the right ventricle. Diastole (from the Greek diastole - expansion) - expansion of the cavities of the heart (associated with relaxation of the muscles of the atria and ventricles), during which it fills with blood; together with systole (contraction) constitutes the cycle of cardiac activity.
Waves and intervals on the ECG.
- P (atrial contraction),
- Q, R, S (all 3 teeth characterize ventricular contraction),
- T (ventricular relaxation),
- U (non-permanent wave, rarely recorded).
A segment on an ECG is a straight line segment between two adjacent waves. The PQ and ST segments are of greatest importance. For example, the PQ segment is formed due to a delay in the conduction of excitation in the atrioventricular (AV) node.
The interval consists of a tooth (a complex of teeth) and a segment. Thus, interval = tooth + segment. The most important are the PQ and QT intervals.
Waves, segments and intervals on the ECG.
There is no point in going into the topic of waves, intervals and segments, as well as into the analysis of the ECG itself. Cardiologists study for years to correctly interpret this complex complex. But you now have a general understanding of what an ECG is and what it looks like. Let's move on to how the electrical impulses themselves are recorded from the human body.
Taking an ECG and leads Where does the potential difference arise in the heart? It's simple. At rest, myocardial cells are charged negatively from the inside and positively from the outside, while a straight line (isoline) is recorded on the ECG tape. When an electrical impulse (excitation) arises and propagates in the conduction system of the heart, cell membranes move from a resting state to an excited state, changing polarity to the opposite (the process is called depolarization). In this case, the membrane becomes positive from the inside, and negative from the outside due to the opening of a number of ion channels and the mutual movement of K+ and Na+ ions (potassium and sodium) from and into the cell. After depolarization, after a certain time, the cells enter a resting state, restoring their original polarity (minus from the inside, plus from the outside), this process is called repolarization.
The electrical impulse sequentially spreads throughout the parts of the heart, causing depolarization of myocardial cells. During depolarization, part of the cell becomes positively charged from the inside, and part is negatively charged. A potential difference arises. When the entire cell is depolarized or repolarized, there is no potential difference. The stage of depolarization corresponds to contraction of the cell (myocardium), and the stage of repolarization corresponds to relaxation. The ECG records the total potential difference from all myocardial cells, or, as it is called, the electromotive force of the heart (cardiac emf).
Schematic location of the cardiac EMF vector (in the center)
Now there will be a very important point regarding the leads and understanding of the accuracy of the signal.
A standard ECG is recorded in 12 leads:
- 3 standard (I, II, III),
- 3 reinforced from limbs (aVR, aVL, aVF),
- and 6 chest (V1, V2, V3, V4, V5, V6).
Standard leads (proposed by Einthoven in 1913). I - between the left hand and the right hand, II - between the left foot and the right hand, III - between the left foot and the left hand.
The simplest (single-channel, i.e. recording no more than 1 lead at any time, as in the photo above) cardiograph has 5 electrodes: red (applied to the right hand), yellow (left hand), green (left leg), black ( right leg) and pectoral (suction cup). If you start with the right hand and move in a circle, you can say that it is a traffic light. The black electrode represents “ground” and is needed only for safety purposes for grounding, so that a person does not get an electric shock in the event of a possible breakdown of the electrocardiograph.
Reinforced limb leads (proposed by Goldberger in 1942). The same electrodes are used as for recording standard leads, but each of the electrodes in turn connects 2 limbs at once, and a combined Goldberger electrode is obtained. In practice, recording of these leads is done by simply switching the handle on a single-channel cardiograph (i.e., there is no need to rearrange the electrodes).
aVR - enhanced abduction from the right hand (short for augmented voltage right - enhanced potential on the right). aVL - enhanced abduction from the left arm (left - left) aVF - enhanced abduction from the left leg (foot - leg)
Chest leads (proposed by Wilson in 1934) are recorded between the chest electrode and the combined electrode from all 3 limbs. The chest electrode placement points are located sequentially along the anterolateral surface of the chest from the midline of the body to the left arm.
Location of 6 chest electrodes when recording an ECG
The 12 leads indicated are standard. If necessary, additional leads are “written”:
- according to Neb (between points on the surface of the chest),
- V7 - V9 (continuation of chest leads to the left half of the back),
- V3R - V6R (mirror reflection of chest leads V3 - V6 on the right [right] half of the chest)
Lead values
For reference: quantities can be scalar and vector. Scalar quantities have only magnitude (numerical value), for example: mass, temperature, volume. Vector quantities, or vectors, have both magnitude and direction; for example: speed, force, electric field strength, etc. Vectors are indicated by an arrow above the Latin letter.
Why were so many leads invented? The EMF of the heart is the vector of the EMF of the heart in the three-dimensional world (length, width, height) taking into account time. On a flat ECG film we can see only 2-dimensional values, so the cardiograph records the projection of the EMF of the heart on one of the planes in time.
Body planes used in anatomy.
Each lead records its own projection of the cardiac EMF. The first 6 leads (3 standard and 3 reinforced from the limbs) reflect the EMF of the heart in the so-called frontal plane (see figure) and allow you to calculate the electrical axis of the heart with an accuracy of 30° (180° / 6 leads = 30°). The missing 6 leads to form a circle (360°) are obtained by continuing the existing lead axes through the center to the second half of the circle.
6 chest leads reflect the EMF of the heart in the horizontal (transverse) plane (it divides the human body into upper and lower halves). This makes it possible to clarify the localization of the pathological focus (for example, myocardial infarction): interventricular septum, apex of the heart, lateral parts of the left ventricle, etc.
When analyzing an ECG, projections of the EMF vector of the heart are used, therefore this ECG analysis is called vector. If we draw a circle and draw lines through its center corresponding to the directions of the three standard and three enhanced limb leads, we obtain a 6-axis coordinate system. When recording an ECG in these 6 leads, 6 projections of the total EMF of the heart are recorded, from which the location of the pathological focus and the electrical axis of the heart can be assessed.
Formation of a 6-axis coordinate system.
The electrical axis of the heart is the projection of the total electrical vector of the ECG QRS complex (it reflects the excitation of the ventricles of the heart) onto the frontal plane. Quantitatively, the electrical axis of the heart is expressed by the angle between the axis itself and the positive (right) half of the axis of standard lead I, located horizontally.
A correct understanding of the normal and pathological vectors of depolarization and repolarization of myocardial cells allows us to obtain a large amount of important clinical information. The right ventricle has a small mass, leaving only minor changes on the ECG, which leads to difficulties in diagnosing its pathology, compared to the left ventricle.
That is, in simple terms, the more leads we can register, the more complete the clinical picture will be. By registering only one lead, we deprive ourselves of important information. But more on this below.
Regarding accuracy Electrocardiographs are measuring instruments. And all measuring instruments must undergo verification, that is, some kind of research, on the basis of which it can be concluded that a particular device is truly accurate in the results that it produces. I don’t know how it is abroad, but in Russia ECGs are verified by a device of the Diatest-4 type, which is a signal generator that meets the requirements as a means of verification of myographs, rheographs, electrocardiographs, encephalographs, ensuring the setting of signal parameters with the required accuracy.
What else affects the reliability of the resulting ECG, besides the accuracy class of the device itself?
- interference in the electrical network;
- excitement of the subject;
- poor-quality contact of the sensor (a special gel is used to improve the passage of the electrical signal through the electrode);
- human factor (negligent attitude of medical personnel, who may incorrectly apply electrodes).
There are still a lot of nuances that can affect the result obtained as a result of ECG registration.
In addition, it should be separately noted that an ECG is not a panacea. An ECG is not capable of detecting absolutely all types of pathologies and abnormalities in the heart. Moreover, ECG is a real-time display of the heart, and many abnormalities are intermittent and intermittent. That is, having some kind of deviation in the functioning of the heart is far from a fact that it will manifest itself at the time of recording the ECG. And in this case, the ECG will be absolutely useless, even if you use the most extensive analysis using 12 leads.
And now it’s time to talk about portable devices for recording ECGs.
Appla Watch and analogues The presentation of the latest Apple Watch model caused a lot of noise. Mainly due to the fact that the gentlemen introduced a new watch feature that allows you to take an ECG directly from the owner’s hand. Almost every week another device with a similar function appears on the market, and journalists from specialized and not so specialized publications call such gizmos a breakthrough in engineering and a new word in the field of self-diagnosis. But let's figure out how it works and what we get as a result.
This watch has a special electrode on the back of the case. To take an ECG, it is necessary to “close” the circuit between the two hands and the heart, i.e. press the button on the side of the watch with your second hand, which will launch the ECG analysis function. What can be determined based on one lead, measuring the potential between the right and left arms? Only heart rate, which can be very useful for screening for atrial fibrillation. After measuring the ECG in this way, the only answer you will receive is that you have normal sinus rhythm or atrial fibrillation. Atrial fibrillation (atrial fibrillation, obsolete) is the most common cardiac arrhythmia. Atrial fibrillation is associated with various cardiovascular diseases that contribute to the development and maintenance of arrhythmia. There are several forms of AF, but the bottom line is that this type of rhythm disorder can be intermittent and not monitored by periodic ECG measurements using just 1 lead. The presence of AF in itself does not necessarily indicate a critical situation. Many people with AF have no symptoms at all, but others may periodically experience a fast or irregular heart rate. AFib becomes dangerous when it causes abnormalities in a person's vital signs, such that a person's blood pressure drops so much that they may lose consciousness, experience shortness of breath, or have a dangerously high pulse. If your heart rate exceeds 100-110 beats per minute, you are experiencing AF with tachysystole. At this point, the emergency room doctors could monitor your pulse with intravenous medications. And while short periods of asymptomatic AF may not be dangerous, persistent AF increases the risk of heart attack, blood clots in the lungs, and cardiac arrest. Depending on the patient's risk factors, some may require blood thinning. The longer your heart remains in uncontrolled AF, the more difficult it is to reverse cardiac changes.
What Apple Watch and analogues cannot do
- Currently, Apple Watch with ECG functionality is not designed to detect heart problems other than AFib.
- They are also not suitable for people who have already been diagnosed with AF - they need to see a doctor regularly.
- They cannot accurately detect the risk of a heart attack. Even a full 12-lead ECG may miss certain signs of a heart attack.
- They are not considered a US Food and Drug Administration (FDA) approved device. The FDA simply issues approvals, “pre-market 510k approval forms,” that explicitly state that the device is not intended for use by people under 22 years of age. The device is considered a Class II home use device, a class that includes condoms and pregnancy tests.
- They are not a device for continuously monitoring the electrical activity of the heart. They can only track the ECG when you touch the wheel with your other hand.
- It is physically impossible to construct an ECG with one electrode. To measure electrical activity, it is necessary to organize a closed circuit passing through the heart. Even a wireless device worn on the other hand will not cope with this, since it will not be part of the same circuit.
All of the above applies to absolutely all portable devices (watches, bracelets, phone cases, etc.) whose operating principle is based on recording potential changes only between two electrodes.
Overall, the new Apple Watch (and its analogues) look like a great tool, but they are not medical-grade devices, and are not a substitute for a professional medical assessment if symptoms arise. And even if the ECG on your Apple Watch looks normal, it doesn't mean you don't have AFib or other cardiac abnormalities.
A couple of thoughts to consider. Devices of this kind are not measuring instruments, they are not verified, and accordingly there is no control over the accuracy of the data obtained with this method of ECG registration. In addition, no special gels are used to improve the conductivity of electrical impulses through the skin, which has a fairly high resistance.
So the decision to purchase this type of device or not is up to you.
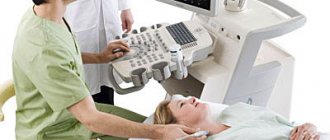
What to do? In addition to a regular ECG, I recommend performing an ECG under stress, i.e. on a treadmill, elliptical, bicycle ergometer. The picture under load will be even more complete. But this type of analysis is also not a panacea. A more informative type of research for pathologies that are periodic in nature is the use of a 24-hour monitor or Holter. There is also such a thing as echocardiography - an ultrasound method aimed at studying the morphological and functional changes of the heart and its valve apparatus. It is based on capturing ultrasound signals reflected from the structures of the heart. This method allows you to establish the condition of soft tissues, determine the thickness of the walls of the heart, the condition of the valve apparatus, the volume of the heart cavities, the contractile activity of the myocardium, see the work of the heart in real time, and trace the speed and characteristics of blood movement in the atria and ventricles of the heart.
Once again, I want to emphasize that when doing an ECG, you need to understand that various pathologies may not be detected. Even myocardial infarction sometimes cannot be tracked on an ECG or EchoCG. In this case, you need to do a blood test for markers of cardiomyocyte damage. But this is only in extreme cases. Currently, the most convincing marker is troponin. Troponin is a protein that is a component of thin muscle filaments and part of the troponin complex located in striated muscle.
How often should an ECG be done? I would recommend at least once a year to monitor the health of your heart muscle. If you are actively involved in sports, especially cyclic sports, then it is best to do this kind of analysis before the start of a new training season and possibly at its peak in the summer. Well, try to treat your heart as carefully as possible and track your heart rate and heart rate variability, which is very useful and informative during the preparation period.
How to prepare for the procedure
No special preparation is required before the examination. The patient must inform the doctor about taking heart medications, as this may affect the results. In this case, a mark is made on the direction.
Before the procedure, it is important to calm down and restore your breathing. While taking an ECG, you cannot move or talk; you need to lie in a relaxed state and breathe evenly.
It is important to listen to and follow the commands of medical personnel. For example, you may need to hold your breath while inhaling for 10-15 seconds.
If the rules of behavior are not followed during the examination, the result may be distorted.
How is electrocardiography done?
During the procedure, the patient is in a supine position. Your arms should be placed along your body and your legs should be straightened. To attach the sensors, the chest, wrists and ankles must be exposed.
Then the doctor moistens the attachment points with sodium chloride to improve conductivity and attaches the electrodes to the arms and legs according to a special pattern: red to the right arm, yellow to the left, black to the right leg, green to the left.
Six sensors are attached to the chest. Then they are connected to a special device - an electrocardiograph and recording begins.
The process of recording cardiac activity takes about one minute. Together with preparation, a period of breathing restoration and removal of electrodes, the procedure will take about 10 minutes. Upon completion, a tape is issued indicating the name of the subject, as well as the recording speed of the cardiogram (25 or 50 mm/sec.). Next, the specialist interprets the recording.
Electrocardiogram. Part 1 of 3: Theoretical Basics of ECG
I’m starting the long-promised ECG cycle, which consists of 3 parts:
- theoretical foundations of ECG,
- ECG interpretation plan,
- some common pathological conditions on the ECG.
Required basic knowledge:
- cardiac conduction system (required),
- how the heart works (preferably).
The cycle was prepared based on the textbook “Electrocardiography” by V. V. Murashko and A. V. Strutynsky
, which is used in teaching medical students from the third year onwards.
This is an entry level guide. Practical work with ECG requires more in-depth knowledge, for example, the level of V. N. Orlov’s “Guide to Electrocardiography”
.
If you are not involved in medicine, but really want to understand a little about ECG, I recommend buying and mastering the book by Murashko and Strutynsky. The most important information is highlighted there separately, and questions and tasks for self-testing have answers
, which allows you to study on your own.
Electrocardiography
is a whole science that studies electrocardiograms (ECG), about which thick works and monographs are written. However, you can learn to distinguish a normal ECG from a pathological one. Mastery comes only with experience, when the number of deciphered ECGs reaches hundreds and thousands. At first, looking at each ECG will take up to 10-15 minutes, but experienced doctors and functional diagnostic specialists need no more than half a minute. The physical foundations of the ECG are studied in the first year of physics, and they begin to really decipher the ECG only in the third year of propaedeutics of internal diseases.
To understand the topic, you must know the conduction system of the heart, otherwise it will be extremely difficult to understand what processes are reflected on the ECG.
What exactly does the ECG machine record?
An electrocardiograph records the total electrical activity of the heart
, or more precisely, the difference in electrical potential (voltage) between 2 points.
Where does the potential difference arise
?
It's simple. At rest, myocardial cells are charged negatively from the inside and positively charged from the outside, while a straight line (= isoline) is recorded on the ECG tape. When an electrical impulse (excitation) arises and propagates in the conduction system of the heart, cell membranes move from a resting state to an excited state, changing polarity to the opposite (the process is called depolarization
).
In this case, the membrane becomes positive from the inside, and negative from the outside due to the opening of a number of ion channels and the mutual movement of K+ and Na+ ions (potassium and sodium) from and into the cell. After depolarization, after a certain time, the cells enter a resting state, restoring their original polarity (inside minus, outside plus), this process is called repolarization
.
The electrical impulse sequentially spreads throughout the parts of the heart, causing depolarization of myocardial cells. During depolarization, part of the cell becomes positively charged from the inside, and part is negatively charged. A potential difference arises
.
When the entire cell is depolarized or repolarized, there is no potential difference. The stage of depolarization corresponds to contraction of
the cell (myocardium), and the stage
of repolarization corresponds to relaxation
.
The ECG records the total potential difference from all myocardial cells, or, as it is called, the electromotive force of the heart
(cardiac emf). EMF of the heart is a tricky but important thing, so let’s return to it a little lower.
Schematic location of the cardiac EMF vector
(center) at one point in time.
ECG leads
As stated above, the electrocardiograph records the voltage (electrical potential difference) between 2 points
, that is, in some
lead
. In other words, the ECG device records on paper (screen) the magnitude of the projection of the electromotive force of the heart (cardiac emf) onto any lead.
Standard ECG is recorded in 12 leads
:
- 3 standard
(I, II, III), - 3 reinforced
from limbs (aVR, aVL, aVF), - and 6 chest
(V1, V2, V3, V4, V5, V6).
1) Standard leads
(suggested by Einthoven in 1913). I - between the left hand and the right hand, II - between the left foot and the right hand, III - between the left foot and the left hand.
simplest
(single-channel, i.e. recording no more than 1 lead at any time) the cardiograph has 5 electrodes:
red
(applied to the right hand),
yellow
(left hand),
green
(left leg),
black
(right leg) and chest ( sucker). If you start with the right hand and move in a circle, you can say that it is a traffic light. The black electrode represents “ground” and is needed only for safety purposes for grounding, so that a person does not get an electric shock in the event of a possible breakdown of the electrocardiograph.
Multichannel portable electrocardiograph
. All electrodes and suction cups differ in color and location.
2) Reinforced limb leads
(proposed by Goldberger in 1942). The same electrodes are used as for recording standard leads, but each of the electrodes in turn connects 2 limbs at once, and a combined Goldberger electrode is obtained. In practice, recording of these leads is done by simply switching the handle on a single-channel cardiograph (i.e., there is no need to rearrange the electrodes).
aVR
- enhanced abduction from the right hand (short for augmented voltage right - enhanced potential on the right).
aVL
- enhanced abduction from the left arm (left - left)
aVF
- enhanced abduction from the left leg (foot - leg)
3) Chest leads
(proposed by Wilson in 1934) are recorded between the chest electrode and the combined electrode from all 3 limbs. The chest electrode placement points are located sequentially along the anterolateral surface of the chest from the midline of the body to the left arm.
I don’t indicate too much detail, because it is not necessary for non-specialists. The principle itself is important (see figure). V1 - in the IV intercostal space along the right edge of the sternum. V2 V3 V4 - at the level of the apex of the heart. V5 V6 - along the left mid-axillary line at the level of the apex of the heart.
Location of 6 chest electrodes when recording an ECG
.
The 12 leads indicated are standard
.
additional
are “written” :
- according to Neb
(between points on the surface of the chest), - V7 - V9
(continuation of chest leads to the left half of the back), - V3R - V6R
(mirror reflection of chest leads V3 - V6 on the right [right] half of the chest).
Lead meaning
For reference: quantities can be scalar and vector. Scalar quantities only have magnitude
(numerical value), for example: mass, temperature, volume.
Vector quantities, or vectors, have both magnitude and direction
; for example: speed, force, electric field strength, etc. Vectors are indicated by an arrow above the Latin letter.
Why were so many leads
?
The EMF of the heart is the vector of the EMF of the heart in the three-dimensional world
(length, width, height) taking into account time. On a flat ECG film we can see only 2-dimensional values, so the cardiograph records the projection of the EMF of the heart on one of the planes in time.
Body planes used in anatomy
.
Each lead records its own projection of the cardiac EMF. First 6 leads
(3 standard and 3 enhanced from the limbs) reflect the EMF of the heart in the so-called
frontal plane
(see figure) and allow you to calculate the electrical axis of the heart with an accuracy of 30° (180° / 6 leads = 30°). The missing 6 leads to form a circle (360°) are obtained by continuing the existing lead axes through the center to the second half of the circle.
The relative position of standard and enhanced leads in the frontal plane
. But there is an error in the figure: aVL and lead III are NOT on the same line. Below are the correct drawings.
6 chest leads
reflect the EMF of the heart
in the horizontal (transverse) plane
(it divides the human body into upper and lower halves). This makes it possible to clarify the localization of the pathological focus (for example, myocardial infarction): interventricular septum, apex of the heart, lateral parts of the left ventricle, etc.
When analyzing an ECG, projections of the EMF vector of the heart are used, therefore such an ECG analysis is called vector
.
Note
. The material below may seem very complex. This is fine. When you study the second part of the series, you will return to it, and it will become much clearer.
Electrical axis of the heart (EOS)
If you draw a circle
and draw lines through its center corresponding to the directions of three standard and three enhanced limb leads, then we obtain a
6-axis coordinate system
. When recording an ECG in these 6 leads, 6 projections of the total EMF of the heart are recorded, from which the location of the pathological focus and the electrical axis of the heart can be assessed.
Formation of a 6-axis coordinate system
. Missing leads are replaced by a continuation of existing ones.
Electrical axis of the heart
- this is a projection of the total electrical vector of the ECG QRS complex (it reflects the excitation of the ventricles of the heart) onto the frontal plane.
Quantitatively, the electrical axis of the heart is expressed by the angle?
between the axis itself and the positive (right) half of the axis of standard lead I, located horizontally.
It is clearly seen that the same EMF of the heart
in projections onto different leads gives different shapes of curves.
Determination rules
The positions of the EOS in the frontal plane are as follows: the electrical axis of the heart
coincides
with the one of the first 6 leads in which
the highest positive teeth
, and
is perpendicular
to the lead in which the size of the positive teeth
is equal to
the size of the negative teeth. Two examples of determining the electrical axis of the heart are given at the end of the article.
Variants of the position of the electrical axis of the heart:
- normal
: 30° > ? - vertical
: 70° > ? - horizontal
: 0° > ? - sharp axis deviation to the right
: 91° > ? - sharp axis deviation to the left
: 0° > ?
Options for the location of the electrical axis of the heart
in the frontal plane.
Normal electrical axis of the heart
approximately corresponds to its
anatomical axis
(in thin people it is directed more vertically from the average values, and in obese people it is directed more horizontally).
For example, with hypertrophy
(growth) of the right ventricle, the heart axis deviates to the right.
In case of conduction disturbances,
the electrical axis of the heart may deviate sharply to the left or right, which in itself is a diagnostic sign. For example, with a complete block of the anterior branch of the left bundle branch, a sharp deviation of the electrical axis of the heart to the left (? ? 30°) is observed, and the posterior branch to the right (? ? +120°).
Complete block of the anterior branch of the left bundle branch
.
The EOS is sharply deviated to the left
(? ?? 30°), because the highest positive waves are visible in aVL, and the equality of the waves is noted in lead II, which is perpendicular to aVL.
Complete block of the posterior branch of the left bundle branch
.
The EOS is sharply deviated to the right
(? ? +120°), because The tallest positive waves are seen in lead III, and the equality of the waves is noted in lead aVR, which is perpendicular to III.
Read further:
- Electrocardiogram. Part 2 of 3: ECG interpretation plan
- ECG part 3a. Atrial fibrillation and supraventricular paroxysmal tachycardia