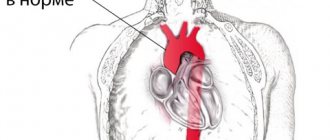
The aorta is the largest unpaired arterial vessel of the systemic circulation, coming from the heart and feeding all internal organs and systems, except the lungs. Throughout its entire length, the aorta has a uniform thickness and the same structure. Under the influence of unfavorable exogenous and endogenous factors, its structure is disrupted: atherosclerotic plaques or fibrous growths appear on the walls, disrupting normal blood flow.
Aortic compaction can be detected using various diagnostic methods: radiographic, fluorographic or ultrasound examination. Having discovered such a defect, specialists must find the main causes of the pathology and prescribe the correct treatment. Otherwise, the disease can lead to serious consequences: dissection of the aortic walls and rupture of the blood vessel. These complications are accompanied by large blood loss and often result in the death of the patient.
Depending on the location of the lesion, the following forms of pathology are distinguished:
- Compaction of the aortic root,
- Consolidation of the aortic arch,
- Consolidation of the ascending aorta,
- Consolidation of the descending aorta.
Causes of aortic pathologies
Aortic pathology occurs under the influence of three groups of factors:
- Removable. These include a sedentary lifestyle, alcohol abuse, smoking and eating large amounts of fatty foods.
- Partially removable. Such factors include diabetes mellitus, obesity, chronic intoxication of the body, infectious diseases and arterial hypertension.
- Unremovable. Such factors of aortic pathology include genetic predisposition and age.
What is the danger of this pathology?
The danger of compaction of the aorta depends on the degree of change in its walls. When it is insignificant, there will be no harm to the body.
If a change in wall thickness is accompanied by calcification, fibrosis, that is, a violation of the structure, this means that serious vascular diseases may occur.
They may be:
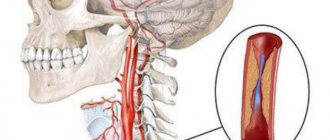
- Thrombosis. When it occurs, the aorta is blocked and blood flow is impaired.
- Aortic aneurysm. With it, the walls of the vessel protrude due to its thinning or stretching.
- Aortic dissection. Blood flows between the layers of the walls, exacerbating their deformation, which leads to its rupture.
- Aortic stenosis. Narrowing of the walls of the vessel, which ends in obstruction.
Blockage of the aorta causes heart pathologies that are difficult to treat. In severe cases, cerebral thrombosis develops. This occurs due to obstruction of the vessels feeding it.
The result of aortic rupture is a large loss of blood, which ends in death if medical care is not provided.
Classification of the disease
Experts distinguish 3 stages of the disease:
- Initial. At this stage, a fatty spot appears in the aorta, the vascular wall loosens, and it swells. Special enzymatic substances are capable of providing vascular protection and dissolving lipids, but their resources are depleted over time. Pathology in the lipid spot stage can be detected during diagnosis even in infants.
- Average. At this stage, lipid deposits grow and a plaque is formed, consisting of fats and connective tissue fibers. At this stage, the plaques are still liquid. They can be dissolved. The main danger is the looseness of the plaques. The deposits can rupture and block the artery.
- Heavy. At this stage, the plaque thickens due to calcium salts and can grow and narrow the lumen of the artery. This leads to blockage of the vessel. The development of tissue necrosis, gangrene of an organ or limb cannot be ruled out.
What it is?
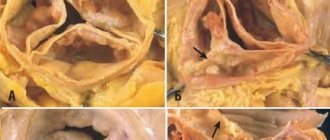
You can understand what fibrosis of the mitral valve leaflets is by looking at the features of its structure and functioning.
The essence of the operation of the valve apparatus is to allow blood to pass (in one direction) when a certain section contracts. The main role is played by the valves, which are represented by loose connective tissue. Their nutrition is carried out through the smallest vessels. The aortic valve has three leaflets (right, left, posterior), and the mitral valve has two (posterior, anterior). Under the influence of irritating factors, the connective tissue becomes coarser, which is why it ceases to fully perform its functions (maintain the flexibility of the valves). Over time, the number of blood vessels supplying the valve is significantly reduced. The cells that make up it begin to die, being replaced by fibrous tissue. It is one of the types of connective tissues, which is characterized by high strength.
Symptoms of atherosclerosis
Symptoms of pathology depend on the location of the process and stage.
The main signs of blockage of blood vessels include:
- periodic increased heart rate;
- noise in ears;
- pulsation in the neck, in the head;
- weakness;
- shortness of breath;
- fatigue;
- dizziness.
The pathology of the coronary arteries is characterized by:
- pressing and burning pain in the chest;
- nausea and vomiting;
- loss of consciousness;
- dizziness;
- shortness of breath (especially when lying down);
- surges in blood pressure.
Arc pathology is characterized by severe pain. They usually radiate to the scapula, left arm and shoulder. The pain intensifies with physical activity and stressful situations. The pain cannot be relieved with nitroglycerin.
The main symptom for lesions of the thoracic region is pain behind the sternum. Patients also suffer from shortness of breath, rapid heartbeat, headaches, dizziness, deterioration of attention and memory, and difficulty swallowing. When the aortic valve is blocked, the patient experiences severe discomfort in the sternum. Pain, shortness of breath, and dizziness may also occur.
Abdominal vascular pathologies lead to abdominal pain. The discomfort has no clear localization. It usually appears after eating. Patients also complain of constipation and diarrhea, bloating, and loss of appetite.
With atherosclerosis of the iliac arteries, the blood supply to the legs deteriorates. The limbs become numb and swollen, muscle tone decreases. In some cases, the disease leads to the appearance of ulcers on the feet.
The numerous complications of the pathology are especially dangerous.
These include:
- protrusion of the artery wall;
- angina pectoris;
- aortic collapse;
- ischemia of tissues and organs;
- heart failure;
- stroke;
- thrombosis of visceral arteries.
With any complications of atherosclerosis, the patient experiences a sharp deterioration in his condition. The pain cannot be relieved even with strong painkillers. In this case, you should call an ambulance immediately!
Treatment of thickening of the aortic walls with folk remedies
If the walls of the aorta are thickened, this problem can be treated with folk remedies. The most common of these is the use of garlic oil.
To do this, the head of garlic needs to be peeled, mashed and poured with a glass of sunflower oil. During the day, this infusion must be stirred periodically, after which, adding the juice of one lemon and stirring again, leave to settle for a week in a cool place.
The described remedy is taken a teaspoon three times a day 30 minutes before meals. One course of such treatment lasts three months, after which you need to stop for a month and then repeat the treatment again.
Diagnosis of pathology
Diagnosis of pathology includes:
- Examination of the patient.
- Anamnesis collection.
- Instrumental and laboratory studies.
At the appointment, the doctor will listen to all complaints, assess the patient’s weight, measure blood pressure, identify all risk factors, and identify signs of pathology.
Laboratory tests necessarily include a blood test assessing indicators such as the concentration of lipoproteins, cholesterol and triglycerides.
Instrumental studies include:
- ECG.
- Aortography and angiography. During such an examination, specialists examine the condition of the vessels, identify aneurysms and other lesions.
- Coronagraphy. This examination allows you to assess the condition of the coronary arteries.
- Ultrasound. The examination reveals deterioration in blood flow, decreased lumen of blood vessels, the presence of blood clots and plaques on the walls, and the appearance of aneurysms.
- Rheovasography. This examination allows you to assess the speed of blood flow.
- CT and MRI. These techniques allow you to quickly detect arterial protrusions, localization and extent of damage.
Diagnostic procedures
Diagnosis of the described pathology includes several stages:
- To begin with, the patient undergoes the necessary tests and is examined for the presence of infections.
- During an auscultatory examination, the doctor may hear changes in the sounds of the aorta and note the appearance of a characteristic noise.
- X-ray examination and fluorography are informative. The aorta is thickened (you already know what this means and why it develops), its shadow in the image is elongated, and a pathological turn or an uncharacteristic bend along the course of the vessel may appear.
- The gold standard today is contrast angiography. During this procedure, the doctor can study the characteristics of blood flow and see certain deviations.
- Ultrasound examination and Doppler sonography are also performed.
- If the doctor needs additional information, the patient is sent for magnetic resonance imaging. Using three-dimensional images, the doctor can carefully examine and study the structure of the aorta and nearby organs.
Treatment
Timely treatment creates opportunities to improve the quality of life and prevent complications. Usually, first of all, the doctor recommends adjusting the patient’s lifestyle.
For the treatment of pathology it is very important:
- Stick to proper nutrition. The patient should avoid salty, spicy and fried foods. It is important to reduce the amount of animal fats. The diet should be based on vegetables and fruits, legumes, low-fat dairy products, and whole grains.
- Devote time to physical activity. They must be regular. Physical activity is not only good for the body, but also allows you to normalize your weight.
- Get proper rest and saturate your body with nutrients. You should sleep at least 7-8 hours, spend time in nature, take vitamins and minerals.
The pathology is directly treated with medication.
Typically patients are prescribed:
- Statins. These substances help reduce the concentration of cholesterol in the blood. Statins reduce the synthesis of aggressive substances.
- Nicotinic acid and derivatives. These substances increase the content of high-density lipoproteins, reduce the level of cholesterol and triglycerides.
- Bile acid sequestrants. These substances remove cholesterol.
- Fibrates. These substances suppress the synthesis of triglycerides in the liver and promote their rapid removal.
- Beta blockers. These substances help eliminate chest discomfort and pain, as well as reduce pressure.
If drug treatment of the pathology is ineffective, operations are performed.
Today, specialists carry out the following interventions:
- Shunting. The operation consists of applying a shunt, which normalizes the impaired blood flow.
- Angioplasty. This operation involves reconstruction of the vessel. As a result of the intervention, its lumen is restored.
If an aneurysm is found, it is excised. The removed area is replaced with a prosthesis. If the aortic valve annulus becomes enlarged, it is excised and replaced with an artificial one.
Important! A ruptured aneurysm can only be treated with surgery. The operation is performed urgently.
Our clinic provides complex therapy for pathologies. Specialists not only eliminate the manifestations of the disease, but also its causes. This increases the patient's standard of living.
Therapy prices depend on numerous factors.
Among them:
- complexity of therapy;
- chosen technique;
- patient's condition;
- presence of concomitant diseases, etc.
The price for complex therapy can be announced in advance. This will allow you to plan the costs of our clinic’s services.
Important! Doctors approach therapy individually. They must take into account all factors that may affect its success.
Why might a lump develop?
A thickening of the aorta can form in any part of it. The arc is considered the most complex section, since at the point where the vessel bends, the speed of blood flow and its dynamics change.
Main reasons for development:
- Atherosclerosis: when lipid metabolism in the blood is disrupted, atherosclerotic plaques form on the walls of blood vessels. Because of this, the lumen of the aorta narrows and blood flow slows down. As a result, fibrous (scar) tissue grows and the walls become thicker.
- Hypertension: with constantly elevated aortic pressure, the elasticity of blood vessels is impaired, and fibrous compounds are formed in them. The walls become hard and thick.
- Infectious diseases (tuberculosis, syphilis, sepsis and others).
- Autoimmune diseases (scleroderma, aortitis).
- Intoxication as a result of long-term treatment with antibiotics leads to dilation and hardening of blood vessels.
In addition, changes in the thickness of the aortic walls can occur as a result of an unhealthy lifestyle and as a consequence of the aging of the body.
Risk factors that increase the chance of developing this pathology in adults:
- old age (over 50 years);
- bad habits - smoking, alcoholism;
- abuse of fatty foods, fast food.
In children, thickening of the valve leaflets and the aorta itself is observed in cases of poor heredity. In childhood, the pathology is in an inactive phase, and later it can be activated.
According to statistics, the most common reasons for the development of compaction are atherosclerosis and old age (more than 80% of diagnosed cases).
Prevention of aortic atherosclerosis
Prevention of aortic atherosclerosis helps prevent the development of the disease. This is easier than treating pathology for a long time.
To eliminate reversible risk factors, it is enough to:
- stop smoking and drinking alcohol;
- avoid overeating and stressful situations;
- get rid of excess weight.
If there is a hereditary predisposition to aortic atherosclerosis, you should regularly donate blood to assess cholesterol levels. This will allow you to quickly identify any disturbances in lipid metabolism and correct it.
It is especially important to prevent pathology for people with:
- obesity;
- hypertension;
- diabetes;
- angina pectoris.
All people over the age of 40 should visit a cardiologist regularly. It is important to pay close attention to health for those who experience angina attacks or have suffered a stroke.
Fibrous rings of heart valves in undifferentiated connective tissue dysplasia
Bibliographic description:
Kuznetsova, V.V. Fibrous rings of heart valves in undifferentiated connective tissue dysplasia / V.V. Kuznetsova.
— Text: direct // Medicine and healthcare: materials of the I International. scientific conf. (Chita, November 2012). - Chita: Young Scientist Publishing House, 2012. - pp. 26-36. — URL: https://moluch.ru/conf/med/archive/62/2893/ (access date: 10/18/2021). In the literature there are reports on the diameter of the mitral and aortic fibrous rings in connective tissue dysplasia. According to research by Yakovlev V.M. et al. [5], an increase in the diameter of the mitral annulus fibrosus in both phases of the cardiac cycle can serve as a criterion for connective tissue dysplasia of the mitral valve with impaired function. This work revealed a statistically significant increase in the diameter of the mitral fibrous annulus in both phases of the cardiac cycle in the group of patients with mitral valve prolapse with the presence of mitral regurgitation in comparison with the control group (patients without connective tissue dysplasia) and within the experimental group (patients with mitral valve prolapse without mitral regurgitation). In the work of Maleev E.G et al. [1] Patients with mitral valve prolapse also had a larger mitral annulus diameter compared to controls.
In JR Matos-Souza et al. [6] examined 627 people with isolated mitral valve prolapse and 627 people matched by age, gender and body mass index without mitral valve prolapse; a total of 454 men and 800 women aged 37.9 ± 0.3 with a body mass index of 23.7 ± 0.1 kg/m2. Individuals with mitral valve prolapse had a significantly larger diameter of the aortic annulus compared with controls (30.4 ± 0.1 versus 29.5 ± 0.1 mm). In addition, multivariate analysis demonstrated an independent association between mitral valve prolapse and aortic annulus size in a model that included the confounding variables age, sex, body mass index, body surface area, blood pressure, and left ventricular myocardial mass index [6].
Regarding the diameter of the other two fibrous rings of the heart in connective tissue dysplasia, no data were found in the available literature.
Purpose of the study:
study of the diameter of the fibrous rings of the heart valves in connective tissue dysplasia and their relationship with anthropometric indicators and morpho-functional indicators of the heart.
Material and methods.
The study is based on data obtained from examining 60 patients with CTD aged from 18 to 44 years (average age - 25.9±6.8 years) and 27 patients without signs of CTD. An objective study was carried out according to generally accepted methods. During the physical examination, the following measurements were taken: height, weight, chest circumference (CHC), waist circumference (WC), arm span, sitting height, hand length, foot length. Based on the data obtained, BMI, body surface area (BSA), proportionality indices (PI between OGK and standing height, PI between leg length and torso length, Pigne index) were calculated. The patients' SBP, DBP and heart rate were determined.
The presence of connective tissue dysplasia in patients was determined by a combination of signs [3]. Doppler echocardiography was carried out on an expert-class ultrasound scanner with color Doppler mapping VIVID-3 from General Electric (USA). Ultrasound examination of the heart was performed in accordance with the recommendations of the European and American Associations of Echocardiography for measurements, calculations and evaluation of the chambers of the heart and great vessels (2006). The location was carried out in the parasternal position (III-IV intercostal space along the left edge of the sternum) in a horizontal position of the patient with the head end elevated by changing the angle of the sensor for sequential imaging of various parts of the heart. To obtain the structural characteristics of the heart, we assessed the final diastolic and systolic diameters (LV EDV, LV ESD, cm), volumes (EDV, ESV, ml) of the LV, the thickness of the posterior wall of the LV (LV TZW, cm) in systole and diastole, the thickness of the interventricular septum ( VSD, cm) in systole and diastole, indexed indicators of LV volumes (ICS, ICDO, ml/m2), LV myocardial mass (LVMM, g). Structural and geometric changes were determined by the LVMM index (LVMI, g/m2), the relative thickness of the walls of the left ventricle and myocardial stress. Left ventricular volumetric parameters and left ventricular ejection fraction were calculated using the Teichholz formulas [4]. Indicators of left ventricular systolic function included: ejection fraction (EF, %), fraction of shortening of the anterior-posterior diameter of the LV in systole (FU, %), velocity of circular shortening of myocardial fibers (Vcf, s-1). When assessing the state of central and peripheral hemodynamics, we took into account the values of stroke (SV, ml) and minute (MR, l/min) volumes, stroke (ml/m2) and cardiac (l/min/m2) indices, total peripheral vascular resistance (TPVR, din*s*cm-5). The diastolic function of the left ventricle was studied according to the time and speed parameters of the transmitral diastolic flow: isovolumetric relaxation time (IVR, s), acceleration time of the early transmitral diastolic flow (AT, s), deceleration of the early transmitral diastolic flow (DT, s), ejection period (ET) , s), peak speeds of fast (E, m/s) and slow (A, m/s) diastolic filling, their ratio (E/A) [4].
Statistical data processing was carried out using the Statistica 6.0 application package from StatSoft and MIX for Windows, as well as Microsoft Excel capabilities. Data analysis for normality of distribution was carried out using the Kolmogorov-Smirnov test. The hypothesis of normal distribution of the quantitative trait was accepted as the null hypothesis. Since the distribution of all characteristics was different from the normal distribution, the characteristics were described by the median and interquartile range (25th and 75th percentiles). Comparisons between two independent groups were performed using the Mann-Whitney U test. The relationship between two variables was assessed using the Spearman correlation coefficient. The level of acceptance or rejection of the null hypothesis was below 0.05.
Results and discussion.
General characteristics of the compared groups. Patients with DST (Table 1) had significantly greater body length compared to the control group (p=0.0001) and significantly lower body weight (p=0.0004), which is a reflection of the general properties of the population of patients with connective tissue dysplasia. At the same time, BMI and BSA in patients with CTD were statistically significantly lower than in patients in the control group (p<0.0001 and p=0.02). WC and OGK in patients with DST were statistically significantly lower than in patients in the control group (p=0.00001 and p=0.0005). Sitting height, hand and foot length, and arm span were not statistically significantly different between groups. SBP, DBP and heart rate in patients with CTD were statistically significantly reduced compared to the control group (p=0.007, p=0.03 and p=0.02, respectively).
Table 1
General characteristics of patients in the study groups, Me (P25-P75)
| Index | Patients with DST ( n =149) | Control group ( n=55) | p |
| Height, cm | 176 (170-183) | 170 (161-177) | 0,0001 |
| Sitting height, cm | 92 (90-96) | 93 (90,5-96,5) | 0,5 |
| OGK, cm | 79 (73-86) | 86 (80-94) | 0,0005 |
| OT, cm | 70 (67-76) | 79 (75,5-88) | 0,00001 |
| Arm span, cm | 179 (173-186) | 181 (171-186,5) | 0,8 |
| Brush, cm | 20 (19-21) | 20 (19-21) | 0,77 |
| Foot, cm | 27(26-29) | 28 (25,5-29) | 0,79 |
| Weight, kg | 60 (53-68) | 66 (57-76) | 0,0004 |
| BMI, kg/m2 | 19,3 (17,7-21,2) | 22,8 (21,2-25,6) | <0,00001 |
| PPT, m2 | 1,76 (1,62-1,89) | 1,81 (1,72-1,94) | 0,02 |
| SBP, mmHg | 100 (90-110) | 110 (100-120) | 0,007 |
| DBP, mmHg | 60 (55-70) | 65 (60-80) | 0,03 |
| Heart rate, beats/min | 70 (64-75) | 77 (69-84) | 0,02 |
Thus, patients with DST were anthropometrically significantly different from the control group. Patients with DST were characterized by significantly greater height, lower body weight, BMI, body surface area, OGK, WC, which is typical for the population of these patients as a whole.
When comparing the structural and geometric parameters of the heart in patients with CTD and individuals in the control group, a number of differences were revealed (Table 2).
The dimensions of all heart cavities, measured in diastole, in patients with CTD were significantly smaller than in patients in the control group (p<0.05), which is explained by the smaller body size in patients with CTD. LV EDV and indexed LV EDV in patients with DST were also significantly reduced compared to control values (p=0.008 and p=0.03). Thus, with the same body surface area, patients with DST were characterized by lower LV EDV. At the same time, there was no significant decrease in LV ESR (p = 0.44), ESV (p = 0.32) and LV ICSV (p = 0.89). The thickness of the IVS and LVSD in diastole did not differ significantly between the groups (p = 0.32 and p = 0.19); in systole, the thickness of the IVS and LVSD was significantly less in patients with DST (p = 0.02 and p = 0.002 ). Relative left ventricular wall thickness did not differ between groups (p=0.37). LVMM and LVMI were significantly lower in the group with DST (p=0.03 and p=0.045). The diameter of the inferior vena cava in the group with DST was underestimated compared to that in the control group (p=0.04). There were no significant differences in the magnitude of the CSMR in the compared groups (p=0.21).
table 2
Structural and geometric characteristics of the heart of patients with DST and the control group, Me (P25-P75)
| Index | Patients with DST ( n= 60) | Control group ( n= 27) | p |
| LV EDV, cm | 4,5(4,23-4,82) | 4,8(4,5-5,0) | 0,009 |
| LV ESD, cm | 3,0(2,7-3,19) | 3,1(2,8-3,2) | 0,44 |
| IVS s, cm | 1,17(1,01-1,27) | 1,25(1,15-1,35) | 0,02 |
| IVD d, cm | 0,82(0,7-0,92) | 0,85(0,8-0,91) | 0,32 |
| LVL s, cm | 1,29(1,2-1,4) | 1,4(1,3-1,5) | 0,002 |
| LVL d, cm | 0,82(0,75-0,93) | 0,86(0,8-0,96) | 0,19 |
| Rel. LV wall thickness | 0,35 (0,32 -0,39) | 0,34 (0,33-0,38) | 0,37 |
| LP, cm | 2,9(2,6-3,18) | 3,3(3,0-3,5) | 0,0004 |
| PP, cm | 3,18(2,9-3,46) | 3,4(3,27-3,6) | 0,003 |
| NPV, cm | 1,06(0,81-1,85) | 1,8(1,43-2,0) | 0,04 |
| RV, cm | 2,1(1,9-2,38) | 2,4(2,0-2,63) | 0,02 |
| LVMM, g | 119,7(95,29-146) | 135,5(117,1-151) | 0,03 |
| LV EDV, ml | 92,75 (79-108,5) | 108 (92,84-118) | 0,008 |
| LV ESV, ml | 35 (27,27-39,66) | 38 (30-41) | 0,32 |
| LV ICD, ml/m2 | 53,65(48,88-61,9) | 58,06(52,45-67,05) | 0,03 |
| LV ICS, ml/m2 | 20,31(16,08-22,54) | 20,03(17,2-22,68) | 0,89 |
| LVMI, g/m2 | 72,29(59,67-82,38) | 74,86(69,9-87,68) | 0,045 |
| LV CVMS, dyn*cm2 | 109,56(95,13-123,99) | 112,92(106,02-122,38) | 0,21 |
According to the literature, various indicators of the state of transaortic and transpulmonary blood flow give an idea of the systolic function of the left and right ventricles[2]. At the same time, indicators of transmitral and transtricuspid diastolic blood flow reflect the diastolic function of the left and right ventricles (Table 3).
Peak transaortic velocity and peak transaortic pressure gradient in the group of patients with CTD were statistically significantly lower than in the control group (p=0.005 and p=0.004). Peak transmitral velocity and peak transmitral pressure gradient did not differ between groups (p=0.51 and p=0.39). There were also no statistically significant differences in peak transtricuspid velocity and peak transtricuspid pressure gradient (p=0.97 and p=0.97). Peak transpulmonary velocity and peak transpulmonary pressure gradient in the group with DST were significantly reduced compared to control values (p=0.006 and p=0.007).
Table 3
Transvalvular peak velocity and pressure gradients of patients with DST and the control group, Me (P25-P75)
| Indicators | Patients with DST (n=60) | Control group (n=27) | p |
| Peak transaortic velocity, m/s | 1,07(0,95-1,18) | 1,17(1,03-1,3) | 0,005 |
| Peak transaortic pressure gradient, mm Hg. Art. | 4,5(3,63-5,6) | 5,48(4,24-6,76) | 0,004 |
| Peak transmitral velocity, m/s | 0,79(0,72-0,9) | 0,8(0,76-0,9) | 0,51 |
| Peak transmitral pressure gradient, mm Hg. Art. | 2,51(2,05-3,24) | 2,56(2,31-3,24) | 0,39 |
| Peak transpulmonary velocity, m/s | 0,89(0,77-0,99) | 0,95(0,9-1,16) | 0,006 |
| Peak transpulmonary pressure gradient, mm Hg. Art. | 3,14(2,39-3,92) | 3,61(3,21-5,38) | 0,007 |
| Peak transtricuspid velocity, m/s | 0,71(0,62-0,78) | 0,7(0,63-0,77) | 0,97 |
| Peak transtricuspid pressure gradient, mm Hg. Art. | 1,96(1,55-2,45) | 1,96(1,59-2,37) | 0,97 |
When studying the contractile function of the left ventricle in patients with CTD and the control group, regular differences were also revealed (Table 4).
LVEF and LVEF were reduced in patients with CTD compared to the control group, but the differences were not statistically significant (p=0.18 and p=0.09, respectively). However, a trend towards a decrease in the left ventricular shortening fraction in patients with CTD can be noted. The rate of circular shortening of myocardial fibers in patients with CTD was significantly lower than in the control group (p = 0.0007). The percentage of systolic shortening of the IVS and LVSD did not differ significantly between groups (p=0.30 and p=0.7).
Table 4
Indicators of LV systolic function in patients with DST and the control group, Me (P25-P75)
| Indicators | Patients with DST ( n =60) | Control group ( n =27) | p |
| EF, % | 64,18 (60,28-68,01) | 65,4 (62-72) | 0,18 |
| UGH, % | 34,82 (31,74-37,78) | 36,36(33,33-41,67) | 0,09 |
| Rate of circular shortening of myocardial fibers, s-1 | 0,11 (0,10-0,13) | 0,13 (0,12 -0,15 ) | 0,0007 |
| % systolic shortening of the IVS | 41,33 (29,47-55,56) | 46,34 (30,53-60) | 0,39 |
| % systolic shortening of the IVS | 56,17 (40,91-73,33) | 60 (50,52-66,67) | 0,7 |
The main integrative indicators characterizing the work of the heart are SV and MO of the ventricles. In individuals with DST, the most important parameters of the myocardial pumping function were underestimated compared to control indicators (Table 5).
Table 5
State of central and peripheral hemodynamics in patients with DST and the control group, Me (P25-P75)
| Indicators | Patients with DST ( n =60) | Control group ( n =27) | p |
| UO, ml | 57,2 (52-69,34) | 70 (61-81) | 0,003 |
| MOC, l/min | 4,08 (3,4-4,82) | 5,46 (4,31-6,24) | 0,0001 |
| UI, ml/m2 | 34,62 (30,87-39,27) | 38,1 (34,78-45,25) | 0,01 |
| SI, l/m2*min | 2,38 (2,03-2,9) | 3,03 (2,55-3,33) | 0,0006 |
| OPSS, dyn*s*cm-5 | 1483,15(1275,5-1789,42) | 1224,39(1103,17-1534,85) | 0,01 |
In persons with DST, all indicators characterizing the functioning of the left ventricle were significantly reduced: SV (p = 0.003), MV (p = 0.0001), CI (p = 0.01), CI (p = 0.0006). OPSS in the group with DST significantly exceeded control values (p = 0.01), which can be explained by a compensatory reaction to a decrease in cardiac output.
Thus, the contractile process of the left ventricle in patients in our sample, compared with the control group, was characterized by a decrease in the speed of circular contraction of myocardial fibers, peak transaortic velocity and the pressure gradient that determines it, SV, MOC, CI, CI. Compensatory reactions from peripheral hemodynamics were characterized by an increase in peripheral vascular resistance.
In recent years, the attention of many researchers of cardiac hemodynamics has been focused on diastolic function, changes in which are the earliest in the pathophysiology of cardiac hemodynamic disorders (Table 6).
In patients with CTD, LV VIR (IVRT) was significantly reduced compared to the control group (p=0.01). The acceleration time of early transmitral diastolic flow AT in patients with DST was statistically significantly less than in the control group (p=0.001). The deceleration time of early transmitral diastolic flow DT, which responds to changes in myocardial stiffness, did not differ between groups, although there was a tendency for it to increase in the group of patients with DST (p = 0.07). The total time of early and late diastolic flow turned out to be statistically significantly longer in the group of patients with DST (p=0.002) due to the lengthening of the time of late diastolic flow. Early diastolic flow time was not significantly different between groups (p=0.38). Thus, in patients with DST, the increase in diastole duration occurred due to the atrial systole phase, that is, diastole was more energy-intensive. Differences in velocity indicators of LV diastolic function in individuals with CTD were represented by a decrease in the atrial component of transmitral diastolic flow (p = 0.01), which resulted in an increase in the ratio of velocity flows (p = 0.075). Thus, the patients in our sample were characterized by impaired diastolic filling of the left ventricle, which was caused by accelerated relaxation, an increase in the period of late diastolic filling and a relative shortening of the period of early diastolic filling.
Table 6
Diastolic function of the left ventricle in patients with DST and the control group, Me (P25-P75)
| Indicators | Patients with DST ( n= 60) | Control group ( n= 27) | p |
| IVRT, ms | 72 (64-80) | 80 (73-88) | 0,01 |
| AT, ms | 72 (60-87) | 88 (80-104) | 0,001 |
| DT, ms | 150(57-192) | 111(44-136) | 0,07 |
| Time of early and late diastolic filling, ms | 501 (444-589) | 430 (358-494) | 0,002 |
| Early transmitral diastolic flow time, ms | 225,5(132-284) | 199 (159-236) | 0,38 |
| Early diastolic filling speed, m/s | 0,79(0,72-0,90) | 0,8 (0,76-0,9) | 0,51 |
| Late diastolic filling rate, m/s | 0,48(0,43-0,58) | 0,6(0,47-0,63) | 0,01 |
| E/A | 1,56(1,38-1,89) | 1,4(1,23-1,73) | 0,08 |
The fibrous skeleton of the heart is formed by four rings interconnected by connective tissue. The atria, ventricles, valves, pulmonary arterial trunk and aorta are tightly attached to this connective tissue framework. In patients with CTD, ROS was significantly less than in patients in the control group (p = 0.002), which can be explained by the smaller size of the body and, accordingly, the heart of patients with CTD (Table 7). At the same time, in patients with DST, a pathological expansion of the IFC was observed, exceeding control values (p = 0.007). According to the data presented in [6], this indicator can serve as a criterion for connective tissue dysplasia of the mitral valve with impairment of its function. Tricuspid and pulmonary annulus fibrosus did not differ between groups (p=0.46 and p=0.8).
Table 7
Diameter of fibrous rings of valves in patients with DST and control group, Me (P25-P75)
| Indicators | Patients with DST ( n =60) | Control group ( n =27) | p |
| AFK, cm | 1,86 (1,73-2,05) | 2,01(1,9-2,3) | 0,002 |
| MFK, cm | 3,57 (3,27-3,81) | 3,2(3,0-3,45) | 0,007 |
| TFC, cm | 2,7 (2,5-3,2) | 2,9(2,8-3,0) | 0,46 |
| PFC, cm | 2,1 (1,9-2,25) | 2,05(1,9-2,25) | 0,8 |
For ROS, positive correlations of moderate strength were obtained with body size (weight (r=0.41, p=0.001), BMI (r=0.38, p=0.003), body surface area (r=0.36, p= 0.005), OGK (r=0.34, p=0.009), OT (r=0.4, p=0.002), proportionality index OGK/growth (r=0.3, p=0.02)), indicators preload (LV EDV (r=0.46, p=0.0003), LV EDC (r=0.41, p=0.001)), central hemodynamic parameters (LV SV (r=0.51, p=0, 00005), IOC (r=0.50, p=0.00007)), LVMM (r=0.43, p=0.0008), indicators of LV systolic function (IVS thickness in systole (r=0.43, p=0.0008), LVAD thickness in systole (r=0.42, p=0.001).Negative correlations of moderate strength were obtained for AFC and OPSS (r=-0.41, p=0.002), Pignier index (r =-0.38, p=0.005 ).
Positive correlations of moderate strength were identified between the diameter of the IFC and body size (height (r=0.31, p=0.02), weight (r=0.33, p=0.02), body surface area (r= 0.37, p=0.007)), left ventricular ejection time (r=0.48, p=0.0004), total time of early and late transmitral diastolic flow (r=0.34, p=0.01) , negative correlations of average strength between the diameter of the IFC and indicators of systolic (LVEF (r=-0.42, p=0.002), the rate of systolic shortening of myocardial fibers (r=-0.54, p=0.00005), % systolic shortening of the IVS (r=-0.29, p=0.04), % systolic shortening of the fibers of the left ventricle (r=-0.37, p=0.007)) and LV diastolic function (time of acceleration of early transmitral diastolic flow (r=- 0.52, p=0.0001), peak velocity of transmitral diastolic flow (r=-0.49, p=0.0003) and its gradient (r=-0.48, p=0.0004)).
Our information about the pathological expansion of the IFC in DST is consistent with the data of other authors [1; 5]. At the same time, we have not found any information in the literature about the narrowing of ROS during DST. The decrease in ROS in our patients can be explained by a decrease in LV volume in diastole (r=0.46, p=0.0003), a decrease in LV SV (r=0.51, p=0.00005). In work [6], individuals with MVP had a significantly larger diameter of the aortic annulus fibrosus compared to controls (30.4 ± 0.1 versus 29.5 ± 0.1 mm). This may be due to the fact that the patients in this study were older (mean age 37.9 ± 0.3 years) and did not differ from the control group in terms of BMI (23.7 ± 0.1 kg/m2). In our sample, the average age of patients with DST was 25.9±6.8 years, the average age of the control group was 25.2±5.4 years; patients differed significantly in BMI. In the group with CTD, the median BMI was 19.3 kg/m2 (quartiles 17.7-21.2), in the control group, respectively, 22.8 (21.2-25.6) kg/m2 (p<0.00001).
In our sample, significant correlations of ROS diameter with BMI (r=0.38, p=0.003), as well as with the Pinier index (r=-0.38, p=0.005) were obtained. Thus, it is more likely that the smaller diameter of the ROS is associated with the smaller body size of patients with CTD and the smaller size of the heart chambers. However, with smaller heart chamber sizes in patients with CTD, the diameters of the TFC and PFC did not differ between the groups.
Literature:
- Analysis of left ventricular myocardial deformation during mitral valve prolapse / E.G. Maleev [et al.] // Vestn. St. Petersburg. honey. acad. postgraduate education. – 2011. – No. 2. – P. 134-142.
- Achievements and prospects for studying the phase structure of the cardiac cycle using Doppler echocardiography. Possible applications in pediatrics [Electronic resource]. – Access mode: https://crawfordcountyredcross.org/kardiologiya/dostizgeniya_i_ perspektivy. html. – [Date of access: 02.21.12].
- Nechaeva G.I. Connective tissue dysplasia: terminology, diagnosis, patient management tactics / G.I. Nechaeva, I.A. Viktorova. – Omsk: LLC Printing House BLANKOM, 2007. – 188 p.
- Rybakova M.K. Practical guide to ultrasound diagnostics. Echocardiography / M.K. Rybakova, M.N. Alekhin, V.V. Mitkov. – M.: Vidar-M, 2008. – 512 p.
- Yakovlev V.M. Connective tissue dysplasia of the mitral valve / V.M. Yakovlev, R.S. Karpov, E.V. Shvetsova. – Tomsk: Sib. Publishing house House, 2004. – 144 p.
- Isolated mitral valve prolapse is an independent predictor of aortic root size in a general population / JR Matos-Souza // Eur. J. Echocardiogr. – 2010. – Vol. 11, No. 3. – P. 302-305.
