YES.
Kuzhel, G.V. Matyushin, T.D. Fedorova E.A., Savchenko, T.M. Zadoenko KGUZ "Krasnoyarsk Regional Hospital No. 2" GOUVPO "Krasnoyarsk State Medical Academy"
An electrocardiogram in 12 standard leads is the method of choice in the diagnosis of acute myocardial infarction (AMI). Quick and accurate diagnosis of AMI is vital, as it makes it possible to immediately begin reperfusion therapy, which reduces the area of necrosis and improves the patient's prognosis. One of the generally accepted criteria for myocardial infarction is ST segment elevation in two or more anatomically adjacent leads [10]. The importance of timely identification of ST segment elevation associated with AMI is emphasized by the fact that neither ST segment depression nor increased biochemical markers of cardiac necrosis (MCN) in the blood serum are indications for thrombolytic therapy [4, 9].
In the early stages of AMI, diagnosis can be significantly difficult, since the ECG is often normal or has minimal abnormalities. Moreover, only half of patients with AMI have obvious diagnostic changes on the first ECG. At the same time, approximately 10% of patients with proven AMI (based on clinical data and positive MCI) will not develop typical changes on the ECG, such as ST segment elevation or depression [4]. However, in most cases, serial ECGs in individuals with AMI show a characteristic evolution that usually corresponds to the typical changes observed in myocardial infarction. In the domestic school of cardiology, it is customary to distinguish four stages of the course of AMI [1].
I.
The most acute stage
. In this stage, which lasts from several hours to several days, changes in the ECG affect only the ST segment and the T wave. The earliest signs of acute myocardial infarction are difficult to distinguish and usually include an increase in the amplitude of the T wave in the affected area, which becomes symmetrical and directional ( hyperacute). Typically, hyperacute T waves are most evident in the anterior precordial leads and are most noticeable when an older ECG is available for comparison. Changes in T wave amplitude can be observed within a few minutes of the onset of infarction and are accompanied by corresponding changes in the ST segment. The optimal time for delivery of a patient to a medical facility is considered to be an interval of up to four hours from the onset of AMI. Unfortunately, ECG changes in the acute stage of myocardial infarction are often not properly assessed, which significantly increases the time it takes for the patient to be delivered to a specialized facility and prolongs the start of reperfusion therapy.
II. Acute stage.
In the acute stage, which usually lasts up to one week, ST segment elevation is recorded and Q waves begin to form. In practice, ST segment elevation is often the earliest sign of AMI and usually becomes noticeable within a few hours from the onset of symptoms. At the initial stages, the angle between the T wave and the ST segment, characteristic of a normal ECG, is lost. The T wave becomes wide and the ST segment rises, losing its normal concavity. During further ascent, the ST segment becomes convex upward. The degree of ST segment elevation varies between small changes of less than 1 mm to pronounced elevation of more than 10 mm. Sometimes the QRS complex, ST segment and T wave merge, forming the so-called monophasic curve.
III. Subacute stage.
The subacute stage of myocardial infarction lasts up to several weeks. During this stage, the ST segment begins to approach the isoline, and negative T waves are formed. In the case of transmural myocardial infarction, the necrosis process is accompanied by changes in the QRS complex, which include a decrease in the amplitude of the R waves and the development of pathological Q waves. Such changes develop as a result of the loss of viable myocardium under recording electrode, therefore Q waves are the only ECG criterion that verifies myocardial necrosis. Q waves can develop within 1 to 2 hours of the onset of AMI symptoms, although this often takes 12 to 24 hours. The presence of pathological Q waves, however, does not necessarily indicate a completed infarction. If ST segment elevation and Q waves are detected on the ECG and the chest pain is of recent onset, the patient may still benefit from thrombolysis or interventional therapy.
IV. Scar stage.
Consolidation of scar tissue ends on average 8 weeks after myocardial infarction. At this stage, the ST segment reverts to the isoline and the amplitude of negative T waves decreases. In the case of extensive myocardial infarction, pathological Q waves are a stable marker of cardiac necrosis. In small infarcts, scar tissue may include viable myocardium, which may reduce the size of the electrically inert region and even cause the eventual disappearance of Q waves.
One of the curious features of the ECG in AMI is the so-called pseudonormalization phenomenon. Wilson's theory of the formation of Q waves implies the formation of a so-called electrical window in case of necrosis, through which the recording electrode records the electrical potentials of the opposite wall. However, despite necrosis, some of the myocardial fibers in the infarction zone remain viable, which explains the characteristic flattening of Q waves during myocardial infarction. However, the potentials of these fibers remain hidden behind the powerful electric vector of the opposite wall. With a repeated infarction, which involves the opposite wall, this vector is significantly reduced, which, in turn, makes it possible to record the potentials of myocardial fibers in the area of the old scar. As a result, in the area of the old scar with pathological Q waves (for example, in the anterior wall), in the event of a re-infarction of the opposite wall (for example, the posterior wall), R waves begin to be recorded. Thus, the registration of R waves in the area where pathological Q waves were previously observed, strongly suggests the formation of an infarction in the opposite wall.
Dynamics of changes in the ST segment and T wave in AMI
The ECG picture during myocardial infarction has its own characteristic development. Firstly, ST segment elevation, as a rule, leads to the formation of Q waves. Secondly, the formation of negative T waves occurs against the background of a characteristic arcuate ST segment elevation.
ST segment elevation associated with myocardial infarction in the anterior wall can persist for a long time if dyskinesia or left ventricular (LV) aneurysm develops. Negative T waves can also persist for a long period and sometimes remain a permanent sign of myocardial infarction. It should be noted that the absence of formation or “restoration” of pre-inverted T waves in the acute stage of myocardial infarction strongly suggests the development of post-infarction pericarditis [11].
Prognosis and nuances of rehabilitation
The patient’s health and life depend on the doctor’s ability to recognize symptoms and pathological changes on the electrocardiogram, make a diagnosis and prescribe the correct treatment.
It is important to know that in case of right ventricular infarction it is strictly forbidden to take nitrates (nitroglycerin) on your own. When prescribing them, careful monitoring of the patient in a hospital setting is required. Morphine is also not suitable for pain relief and is used only when absolutely necessary, since it dilates blood vessels and leads to a decrease in blood pressure and hemodynamic disturbances.
The main goal of therapy is to moderately reduce the load on the right ventricle, control the frequency and rhythm of heart contractions, regulate low blood pressure by intravenous drip administration of saline and other drugs that restore the missing blood volume (Reopoliglyukin, Reosorbilact, Stirofundin).
The treatment process is monitored using EchoCG and ECG. It is important for the patient to remain calm, since unnecessary movements, even such as moving from a horizontal to a vertical position when getting out of bed, strain the heart and can lead to aggravation of the condition.
Another nuance of recovery after a heart attack is the preference for drug treatment, since invasive interventions and studies can destabilize the functioning of the cardiovascular system. If thrombolytics are prescribed in a timely manner, surgery may not be necessary.
The consequence of transmural right ventricular infarction is often arrhythmia, which must be monitored during the recovery period, regularly conduct electrocardiography and use antiarrhythmic drugs.
Reciprocal ST segment depression
ST segment depression in leads opposite the affected area, otherwise known as reciprocal depression, is a highly sensitive indicator of AMI. The pathogenesis of reciprocal changes remains unknown. Reciprocal changes have high sensitivity and a positive predictive value of up to 90% and are observed in approximately 70% of lower and up to 30% of infarcts involving the anterior wall of the LV, although, of course, their absence does not exclude the diagnosis of AMI [4, 5]. As a rule, ST segment depression is horizontal or oblique. The presence of reciprocal changes is especially important when there is doubt about the clinical significance of the recorded ST segment elevation. We especially note that reciprocal changes may be the only sign of AMI against the background of still unobvious ST segment elevation. Similar situations often occur in cases of myocardial infarction with damage to the lower wall. The presence of severe ST segment depression in the precordial leads against a background of normal heart rate or bradycardia in a patient with an ischemic painful attack strongly requires the exclusion of AMI.
Myocardial infarction of the anterior wall
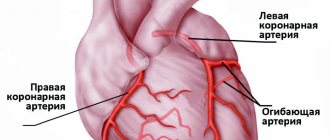
Anteroseptal ST-segment elevation infarction in leads V1-V3 is a highly accurate indicator of left anterior descending coronary artery (LADCA) involvement. ST segment elevation in these three leads and in lead aVL, combined with ST segment depression of more than one mm in lead aVF, indicates occlusion of the proximal segment of the LCA. ST-segment elevation in leads V1, V2, and V3 without significant ST-segment depression in the inferior leads suggests occlusion of the LCA after origin of the first diagonal branch.
In some cases, the LPNCA wraps around the apex of the LV and supplies blood to the apical parts of the inferior wall in the distal part of the posterior interventricular groove. Rarely, the LCA extends along the entire length of the posterior sulcus, replacing the posterior descending artery. In the case of ST segment elevation in leads V1, V2 and V3 with ST elevation in the inferior leads, occlusion of the LCA of the distal origin of the first diagonal branch, in the area that irrigates the inferoapical parts of the LV, can be assumed [7].
Differences in clinical practice and diagnosis from other forms
Right ventricular infarction occurs in approximately 30% of patients with inferoposterior (diaphragmatic) left ventricular infarction. Isolated necrosis of the right is much less common, in only 10% of cases.
Due to tissue necrosis, RV contractility decreases and symptoms of acute heart failure increase. The main feature of right ventricular infarction is the absence of blood stagnation, fluid accumulation in the pulmonary circulation (lungs), and low pressure.
Right ventricular infarction on the ECG looks like ST segment elevation in the lower precordial leads (V3R and V4R) above the baseline. It is evaluated in all patients with acute MI and angina.
Also in diagnostics, the gold standard remains the measurement of cardiac enzymes and myocardial necrosis factors in blood serum.
The main clinical signs of right ventricular infarction:
- Swelling of the jugular (neck) veins on inspiration.
- Low blood pressure, which manifests itself as weakness, dizziness, nausea.
- Enlarged liver. It stretches due to the increased volume of blood passing through it. Pain occurs, such as when running or intense exercise.
- Accumulation of fluid in the abdominal cavity.
- Swelling of the lower extremities, which rises up from the ankles to the abdomen. As MI progresses, it develops into edema of the entire body.
- Interruptions in the functioning of the heart due to damage to the conduction system. Symptoms vary: from decreased pulse and dizziness to loss of consciousness due to atrial fibrillation.
- Pain in the heart area with irradiation, characteristic of a heart attack in general, also occurs when the right ventricle is damaged. However, in older people and diabetics there may be no symptoms at all. In these cases, cicatricial changes are often detected on control cardiography.
Lower IM
AMI with isolated ST-segment elevation in leads II, III, and aVF is usually associated with damage to the right coronary artery (RCA) or the distal circumflex artery (CA). A rather unpleasant feature of AMI with damage to the inferior wall is that the ST segment elevation associated with the infarction can develop over a long period, up to two weeks, to become evident on the ECG [4]. The inferior wall can be supplied with blood from the right coronary artery (in 80% of cases) or from the OA, which is a branch of the left coronary artery.
ST segment elevation in lead III is greater than in lead II, and ST segment depression of more than one mm in leads I and aVL suggests damage to the RCA, which supplies the inferior wall. In the case of blood supply to the lower wall from the OA, the rise of the ST segment in lead III does not exceed the rise in lead II. In this case, either an elevation of the ST segment in aVL is observed, or it is located on the isoline [6, 7].
Journal "Emergency Medicine" 1(20) 2009
Isolated right ventricular myocardial infarction (RMI) is extremely rare, but in the group of patients with acute posterior infarction, concomitant right ventricular damage is detected by ECG data with a frequency of 30–50% [1, 2]. The combination of posterior infarction with UTI is more often observed in elderly people and is associated with an increase in in-hospital mortality and the number of complications. Approximately 5% of patients with right ventricular infarction develop cardiogenic shock with a high risk of death [3]. Management of patients with hemodynamically significant VRT differs from that adopted for isolated left ventricular lesions and includes limiting the use of vasodilators and diuretics, volume loading, inotropic support, control of rhythm and heart rate [4]. To select the optimal patient management tactics, early recognition of UTI is extremely important.
This report presents a clinical observation of a hemodynamically significant right ventricular infarction in a patient with acute posterior myocardial infarction. In this case, timely detection of UTI significantly influenced the treatment strategy and made a certain contribution to the favorable outcome of the disease.
Patient G., 66 years old, was delivered to the clinic as an emergency on July 17, 2005 at 12:10, 2 hours after the appearance of intense burning pain in the chest. Pain of this nature appeared for the first time, for no apparent reason, was accompanied by general weakness and did not decrease after taking 2 tablets of nitroglycerin, which forced the patient to seek medical help. There is a history of increased blood pressure to 160/100 mm Hg. for 3 years, smoking experience for more than 20 years.
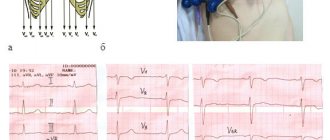
The ECG recorded by the ambulance team 50 minutes from the onset of the pain syndrome (Fig. 1) shows signs of acute posterior phrenic myocardial infarction, subendocardial ischemia of the apical-lateral sections of the left ventricle; escape rhythm of the atrioventricular (AV) connection with a heart rate of 46/min, complete right bundle branch block (RBBB).
At the prehospital stage, nitroglycerin, no-spa, analgesics (analgin, omnopon), dexamethasone and mezaton were administered, after which the patient was taken to the ICU of City Clinical Hospital No. 8 in Kharkov with a diagnosis of coronary artery disease, acute myocardial infarction of the posterior wall of the left ventricle. Cardiosclerosis. GB III Art.
Upon admission to the ICU, the patient's condition is serious. Lethargy, acrocyanosis, and cold extremities were noted. There is vesicular breathing over the lungs, isolated dry rales. Respiratory rate 16/min. Heart sounds are muffled, blood pressure 80/60 mm Hg, severe bradycardia (heart rate 42/min). The liver is not enlarged. There is no peripheral edema. According to laboratory data, leukocytosis was 11.7 x 10⁹/l, aneosinophilia, hyperglycemia (blood glucose 9.0 mmol/l), a slight increase in creatinine level (166 μmol/l).
In order to stabilize hemodynamics, atropine 1 mg was administered intravenously, then prednisolone 60 mg, dopamine infusion and inhalation of humidified oxygen were started. Aspirin was prescribed at a dose of 325 mg, enoxaparin 80 mg subcutaneously 2 times a day. At 12:20, 2 hours 20 minutes after the onset of anginal pain, thrombolysis was performed with streptokinase - 1.5 million units as an intravenous infusion over 50 minutes.
As a result of the therapy, it was possible to completely relieve the pain syndrome. ECG dynamics confirmed the effectiveness of the thrombolysis performed.
The ECG taken at 15:35 shows a significant decrease in the ST segment displacement in all leads, the beginning of the formation of a negative T wave in leads III and aVF. There are no pathological Q waves. Bradycardia persists, the replacement rhythm of the AV junction with a heart rate of 42/min, complete blockade of the PNPG. In leads II, III and V6, individual P waves are detected, not associated with QRS complexes, the frequency of sinus impulses is 40/min (Fig. 2).
However, despite the presence of signs of reperfusion, the ongoing infusion of dopamine and repeated administration of atropine, the patient’s general condition remained severe, the clinic of cardiogenic shock persisted (arterial hypotension with a blood pressure level of 70–90/40–60 mm Hg, signs of peripheral hypoperfusion, anuria ). Based on clinical data, hemodynamically significant right ventricular myocardial infarction was suspected. To test this assumption, an ECG was recorded with additional right chest leads.
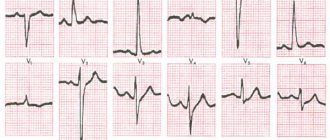
An ECG taken at 4:00 p.m. maintains the rhythm of the AV junction with a heart rate of 43/min. The disappearance of PNPG block changes the repolarization pattern in lead V1, where the initial downward depression of the ST segment is replaced by its significant elevation. Registration of additional leads on the right side of the chest reveals a pathological form of the ventricular complex in the form of QS from V3R to V6R and significant, up to 3 mm, ST segment elevation in all right chest leads (Fig. 3). Identification of UTI required a change in patient management tactics: 1 ) a volume load was undertaken under the control of hemodynamic parameters (BP, central venous pressure) in the form of intravenous administration of 1100 ml of liquid - 900 ml of physiological sodium chloride solution and 200 ml of rheopolyglucin); 2) in parallel with the administration of fluid, dopamine infusion was continued; 3) electrical cardiac pacing (PAC) was started to eliminate pathological bradycardia. As a result, after 2 hours the blood pressure increased to 100/60 mm Hg, and by morning - to 130/80 mm Hg.
On the ECG on July 18, 2005 at 09:00 - pacemaker rhythm, asynchronous ventricular stimulation with a frequency of 60/min. No signs of atrial electrical activity. ST elevation in the inferior and right precordial leads (Fig. 4).
Due to the increase in the patient's own heart rate to 50–60/min and stabilization of hemodynamics, electrical stimulation of the heart was stopped.
Over the next 3–4 days, the severity of the patient’s condition was due to acute renal failure (ARF), which complicated the course of the disease. The patient complained of nausea and general weakness. In the objective status: slight general cyanosis, dry skin, dilation of the jugular veins. The function of external respiration is compensated, without signs of pulmonary congestion. Increase in blood pressure to 160–170/80 mmHg, heart rate 60–80/min, increase in central venous pressure to 240–270 mmHg. The liver is enlarged - the lower edge is 4 cm below the costal arch, painful on palpation. There was no peripheral edema. Oligoanuria (from July 18 to July 21, the volume of urine excreted per day was 0–250–300–1000 ml, respectively).
During this period, according to laboratory data, hyperazotemia was observed (the level of plasma creatinine from 19.07 to 22.07 increased from 475 to 896 μmol/l), an increase in the level of liver enzymes (as of 19.07 ALT - 2.64 mmol/h l, AST - 2.01 mmol /h·l, without decrease by 22.07); leukocytosis 16.0 x 10⁹/l, aneosinophilia, neutrophilia with a shift of the formula to the left on July 19, with positive dynamics by July 22 in the number of leukocytes and formula, but with an increased ESR. Clinical urine analysis: specific gravity 1010, proteinuria 0.6 g/l, leukocytes - thick, erythrocytes - throughout the entire field of view. The patient was examined by a urologist: a prostate adenoma was detected, which did not require catheterization of the bladder. X-ray of the chest organs 20.07: pulmonary emphysema, diffuse pneumosclerosis. Left ventricular hypertrophy. Significant expansion of the aorta with atherosclerosis and severe calcification of the walls.
Therapy was supplemented with intravenous bolus and then drip administration of furosemide up to 160 mg/day against the background of infusion of dopamine solution in diuretic doses. Detoxification therapy was carried out (reosorbilact, glucose solution with insulin, soda enemas).
On the ECG recorded during this period, attention was drawn to the unusual shape and duration of the P waves, however, the low voltage of the atrial waves during standard ECG recording made it difficult to analyze their configuration.
ECG on July 20, 2005 was taken with additional amplification (1 mV = 2 cm): sinus rhythm with heart rate 60/min, 1st degree AV block. Signs of atrial infarction in the form of elevation of the PQ segment, especially distinct in leads II, III and aVF (Fig. 5).
The next stage of the disease (from July 22 to July 26, 2005) is associated with the resolution of acute renal failure. On these days, against the background of polyuria (2500–3000 ml of urine per day), there was a decrease in central venous pressure to normal and reduced levels (50–100 mm H2O) with the development of tachycardia up to 100–120/min, and moderate arterial hypertension persisted. Positive dynamics of laboratory parameters were observed, namely a decrease in azotemia (07/25/2005 - creatinine 412 µmol/l, urea 24.4 mmol/l), normalization of liver enzymes, decrease in proteinuria and the number of urinary sediment elements.
On the ECG recorded on July 25, 2005 before the patient was transferred from the ICU: sinus rhythm with heart rate 86/min, duration of the PQ interval = 0.20 s. Subacute stage of Q-positive posterior diaphragmatic MI. Complete blockade of PNPG.
Infarction of the right ventricle and atrium was verified by echocardiography on 08/04/2005: significant dilatation of the right atrium was detected - 5.2 cm, zones of hypo- and akinesia of the free wall of the right ventricle with a tendency to increase its cavity, hypokinesia of the basal posteroseptal segments of the left ventricle with normal sizes of the left chambers of the heart (left atrium - 3.4 cm, end-diastolic size of the left ventricle - 4.6 cm, end-systolic size of the left ventricle - 3.4 cm, myocardial thickness of the posterior wall and interventricular septum - 1 cm) and relatively preserved systolic function of the left ventricle (ejection fraction - 51%).
In the infarction department, the patient received beta-blockers, statins, and antiplatelet drugs. There were no complaints, the condition was assessed as satisfactory, the expansion of the motor regime was tolerated well.
During a scheduled ECG on 08/05/2005, an irregular form of atrial flutter with a varying degree of AV block was recorded: 2: 1–4: 1. Complete block of PNPG. Subacute stage of extensive posterior phrenic myocardial infarction involving the right ventricle (Fig. 6).
On the 19th day of illness, 08/05/2005, the patient was transferred to the rehabilitation department in satisfactory condition.
In conclusion, I would like to note some features of the presented case. First, the patient's acute posterior myocardial infarction was accompanied by URI, sinus node dysfunction, atrial infarction, and atrioventricular block. This complex of disorders is characteristic of proximal occlusion of the dominant right coronary artery and is associated with a high risk of developing cardiogenic shock and death. Timely recognition of right ventricular infarction and correction of the therapy allowed the patient to survive the critical period of cardiogenic shock, and the long-term prognosis of such patients is the same relatively favorable as with a posterior infarction without involvement of the right ventricle [5]. This is due to the fact that acute ischemic injury to the right ventricle does not actually always result in necrosis and its function is usually completely restored over time [6, 7].
Another feature of the patient was the development of acute renal failure, the severity of which did not correspond to the duration of arterial hypotension. It can be assumed that kidney damage during the period of cardiogenic shock was aggravated by concomitant atherosclerotic damage to the renal arteries (taking into account the elderly age of the patient, signs of aortic atherosclerosis and coronary atherothrombosis, the recent onset of arterial hypertension and the lack of data on a history of kidney disease).
Right ventricular myocardial infarction
Right ventricular MI is usually associated with occlusion at the level of the proximal RCA. The most sensitive ECG sign of right ventricular MI is ST segment elevation of more than one mm in lead V4R with a positive T wave in this lead [5]. This sign is rarely observed more than 12 hours after AMI, so right leads should be recorded as soon as possible in all patients with inferior wall infarction. On a standard 12-lead ECG, signs of AMI involving the right ventricle are ST segment elevation in lead V1 combined with ST segment elevation in leads II, III, and aVF (STIII greater than STII).
Right ventricular infarction is often missed because the standard 12-lead ECG does not have high sensitivity for right ventricular infarction. At the same time, the diagnosis of right ventricular infarction is important, as it may be associated with a state of hypotension caused by treatment with nitrates or diuretics. At the same time, in contrast to cardiogenic shock, which requires differential diagnosis, the patient responds well to fluid administration.
In approximately 40% of cases, inferior wall AMI is complicated by right ventricular infarction [2, 6]. Less commonly, right ventricular infarction is associated with occlusion of the circumflex artery and, if this branch is dominant, may be associated with inferolateral infarction. Right ventricular infarction can complicate anterior wall AMI and can rarely occur as an isolated phenomenon [15].
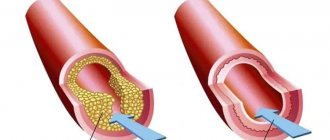
Features of right ventricular infarction: anatomy and physiology of the process
The right ventricle (RV) is a thin-walled chamber of the heart that pushes oxygen-depleted blood into the lungs through the pulmonary arteries.
As a result, the pancreas operates under conditions of low pressure and hypoxia. It is supplied with blood both in systole and in diastole - both during tension and relaxation of the heart muscle. These factors make the right ventricle more resistant to the development of myocardial infarction (MI) compared to the left. However, it is not protected from the negative effects of atherosclerosis. Isolated necrosis of cardiac muscle cells occurs when the terminal branches of the right coronary artery are blocked by blood clots or critically narrowed.
Large-focal myocardial infarction of the left ventricle can spread to the right, and the entire posterior wall of the heart is affected. This is a common cause of gastralgic clinical MI with characteristic abdominal pain, vomiting and nausea.
If the myocardial nutrition is disrupted, the operating conditions of the conduction system change (it sends electrical impulses that cause the heart to contract). This inevitably leads to the development of arrhythmia with especially dangerous forms - atrial fibrillation, sinus bradycardia and atrioventricular block.
Myocardial infarction of the posterior wall
The posterior descending coronary artery (PDCA), which supplies blood to the posterobasal sections, can be a branch of the RCA (in 85-90% of cases) or a branch of the OA (12), which determines the right or left type of coronary circulation. The diagnosis of AMI with posterior-basal lesions is often difficult when using a standard 12-lead ECG, while early detection of coronary thrombosis is very important from the point of view of prescribing thrombolytic therapy.
Changes in the ECG during AMI of the posterior basal sections are indirectly manifested in the anterior precordial leads. Leads V1-V3 record the potentials of not only the anterior, but also the opposite (posterior) wall, and changes in blood supply in this area are reflected in these leads. Typically, there is an increase in R waves that become wider and more dominant, as well as ST segment depression and high amplitude T waves pointing toward the posterior wall [3]. The use of leads V7-V9, recording posterobasal potentials, will show ST segment elevation in patients with AMI.
These additional leads provide valuable information and help in identifying patients who may benefit from urgent invasive therapy. In any case, registration of ST segment depression in leads V1-V2 should serve as a reason to exclude AMI of the posterobasal parts of the LV. In the cicatricial stage, a previous myocardial infarction in the posterior-basal sections will be indicated by the ratios R/S > 1 in lead V2 and RV2 > RV6, recorded against the background of the horizontal position of the electrical axis of the heart [2].
Lateral wall infarction.
Lesions in the proximal circumflex artery are often associated with lateral infarction and changes in leads I, aVL, V5-V6. Often, AMI can manifest itself as changes that occur isolated in lead aVL. In such cases, it is customary to diagnose AMI with damage to the high lateral parts of the LV [3].
Treatment of acute heart failure during right ventricular myocardial infarction
December 11, 2010 0
To determine the optimal criteria for infusion therapy, the study included 42 patients with lower myocardial infarction and UTI complicated by ventricular dysfunction. All patients were prescribed dobutamine and intravenous administration of rheopolyglucin (300 ml/hour) under the control of pulmonary artery pressure (PAP), pulmonary artery wedge pressure (PAWP), and central venous pressure (CVP). To assess perfusion, the cardiac index (CI) was determined using the thermodelution method.
Echocardiographic examination was performed before treatment and at optimal PAWP values. It was found that in patients with OPHL, with initially low values of PAP and PAWP (16.2 ± 0.21 and 7.0 ± 0.18 mm Hg), CVP was increased (11.2 ± 0.25 mm Hg. ). With the administration of rheopolyglucin, CI increased from 1.82 ± 0.03 to 2.51 ± 0.04 l/min/m2 (p <0.001) with PAWP 18 mm Hg. Art. There was no pronounced rise in central venous pressure. Further administration of fluid with an increase in PAWP to 20 mm Hg. Art. did not lead to a further increase in CI and was accompanied by a significant increase in CVP (from 13.7 ± 0.23 to 16.2 ± 0.24 mm Hg; p < 0.001).
During treatment, the LV size increased (from 52.3 ± 0.57 to 54.4 ± 0.60 mm; p < 0.05) and its ejection fraction increased (from 37.5 ± 0.87 to 41.9 ± 0.99%; p < 0.05) in the absence of significant dynamics in the right chambers of the heart. The data obtained indicate the advisability of increasing the preload on the right ventricle for the treatment of ARVD. Fluids should be administered in parallel with treatment with inotropic support drugs.
The target PAWP in the treatment of acute respiratory failure is 18 mm Hg. Art., at which the volume and LVEF increase, indicating an improvement in its filling. Fluid infusion is not advisable if the increase in CVP is greater than the increase in PAWP. In this case, the increase in LV end-diastolic pressure is offset by a higher rate of increase in RV filling pressure, and no increase in LV filling occurs. Right ventricular myocardial infarction (RMI) complicates the course of lower myocardial infarctions (MI) in 30–50% of cases. With extensive damage to the right ventricle (RV), its contractility decreases and acute right ventricular failure (ARF) develops, a characteristic feature of which is hypovolemia of the pulmonary circulation [1–4]. Treatment of ARVN is aimed at increasing the return of blood to the left chambers of the heart. On the one hand, this is an increase in RV contractility, on the other, an increase in preload on the right ventricle.
An increase in contractility is achieved by using inotropic drugs, an increase in preload is achieved by infusion of plasma expanders to increase the return of blood to the pancreas and, as a consequence, increase the release of blood into the pulmonary artery [3, 5]. While the dosing regimens of inotropic drugs are well known, there are no clear recommendations in the literature on the volume of fluid infused during OP.
Purpose of the study. To develop optimal values of pulmonary artery wedge pressure, which must be achieved when conducting infusion therapy under the control of central hemodynamic parameters, and also to compare the volume of infusion with the optimal values of PAWP.
Read the full publication
ECG predictors of reperfusion
Pathogenetic therapy for AMI has the goal of restoring blood flow in the affected artery. Lack of restoration of blood flow (reperfusion) is the most powerful predictor of the development of LV systolic dysfunction and the risk of death after AMI. In the absence of reperfusion, 30-day mortality can reach 15% [14]. In turn, the resolution of ST segment elevation is an indicator of improved short-term (30-day) and long-term (one-year) prognosis [5]. Assessing ST segment resolution is also useful for deciding on further management of the patient.
Failure to resolve the ST segment within the first 90-120 minutes after thrombolytic administration should be a reason to consider angioplasty. A specific marker of reperfusion that has occurred is considered to be a reduction in ST segment elevation by more than 50-70% in the lead with maximum elevation, which is associated with the most favorable further prognosis. At the same time, a number of authors propose a criterion of 50% reduction in ST segment elevation after 60 minutes of reperfusion therapy as a predictor of a good prognosis in individuals with AMI [13]. Considering that the maximum effect from subsequent angioplasty after thrombolysis is achieved no later than 6-8 hours from the onset of AMI [14], reducing the time for assessing reperfusion has good reason.
Other ECG markers of reperfusion include T wave inversion within four hours of AMI onset. T wave inversion, which occurs within the first hours of reperfusion therapy, is a highly specific sign of restoration of blood flow. T wave inversion, which develops after more than four hours, is associated with natural ECG dynamics during AMI and does not indicate restoration of blood flow. Accelerated idioventricular rhythm 60-120 beats/min, late, paired, ventricular extrasystoles are also a highly specific marker of reperfusion. These rhythms are considered not dangerous and, as a rule, do not require antiarrhythmic therapy. Polymorphic ventricular tachycardia and ventricular fibrillation can also be associated with reperfusion, but are rare and more often a consequence of persistent coronary occlusion.