ECG interpretation
ECG interpretation plan
An electrocardiogram reflects only electrical processes in the myocardium: depolarization (excitation) and repolarization (restoration) of myocardial cells.
Correlation of ECG intervals with the phases of the cardiac cycle (ventricular systole and diastole).
Normally, depolarization leads to contraction of the muscle cell, and repolarization leads to relaxation.
To simplify further, instead of “depolarization-repolarization” I will sometimes use “contraction-relaxation”, although this is not entirely accurate: there is the concept of “electromechanical dissociation”, in which depolarization and repolarization of the myocardium do not lead to its visible contraction and relaxation.
Elements of a normal ECG
Before moving on to deciphering the ECG, you need to understand what elements it consists of.
Waves and intervals on the ECG. It is curious that abroad the PQ interval is usually called PR.
Any ECG consists of waves, segments and intervals.
Teeth are convex and concave areas on the electrocardiogram. The following waves are distinguished on the ECG:
- P (atrial contraction),
- Q, R, S (all 3 teeth characterize ventricular contraction),
- T (ventricular relaxation),
- U (non-permanent wave, rarely recorded).
SEGMENTS A segment on an ECG is a segment of a straight line (isoline) between two adjacent teeth. The PQ and ST segments are of greatest importance. For example, the PQ segment is formed due to a delay in the conduction of excitation in the atrioventricular (AV) node.
INTERVALS An interval consists of a tooth (a complex of teeth) and a segment. Thus, interval = tooth + segment. The most important are the PQ and QT intervals.
Waves, segments and intervals on the ECG. Pay attention to large and small cells (more about them below).
QRS complex waves
Since the ventricular myocardium is more massive than the atrial myocardium and has not only walls, but also a massive interventricular septum, the spread of excitation in it is characterized by the appearance of a complex QRS complex on the ECG.
How to correctly identify the teeth in it?
First of all, the amplitude (size) of individual waves of the QRS complex is assessed. If the amplitude exceeds 5 mm, the tooth is designated by a capital (capital) letter Q, R or S; if the amplitude is less than 5 mm, then lowercase (small): q, r or s.
The R wave (r) is any positive (upward) wave that is part of the QRS complex. If there are several teeth, subsequent teeth are indicated by strokes: R, R', R”, etc.
The negative (downward) wave of the QRS complex, located before the R wave, is designated as Q (q), and after - as S (s). If there are no positive waves at all in the QRS complex, then the ventricular complex is designated as QS.
Variants of the QRS complex.
Fine:
the Q wave reflects depolarization of the interventricular septum (the interventricular septum is excited)
R wave - depolarization of the bulk of the ventricular myocardium (the apex of the heart and adjacent areas are excited)
S wave - depolarization of the basal (i.e. near the atria) parts of the interventricular septum (the base of the heart is excited)
The RV1, V2 wave reflects the excitation of the interventricular septum,
and RV4, V5, V6 - excitation of the muscles of the left and right ventricles.
Necrosis of areas of the myocardium (for example, during myocardial infarction) causes expansion and deepening of the Q , so close attention is always paid to this wave.
ECG analysis
General scheme of ECG decoding
- Checking the correctness of ECG registration.
- Heart rate and conduction analysis:
- assessment of heart rate regularity,
- heart rate (HR) counting,
- determination of the source of excitation,
- conductivity assessment.
- Determination of the electrical axis of the heart.
- Analysis of the atrial P wave and P-Q interval.
- Analysis of the ventricular QRST complex:
- QRS complex analysis,
- analysis of the RS - T segment,
- T wave analysis,
- Q-T interval analysis.
- Electrocardiographic report.
Normal electrocardiogram.
1) Checking the correctness of ECG registration
At the beginning of each ECG tape there must be a calibration signal - the so-called control millivolt. To do this, a standard voltage of 1 millivolt is applied at the beginning of the recording, which should display a deviation of 10 mm on the tape. Without a calibration signal, the ECG recording is considered incorrect.
Normally, in at least one of the standard or enhanced limb leads, the amplitude should exceed 5 mm, and in the chest leads - 8 mm. If the amplitude is lower, this is called reduced ECG voltage, which occurs in some pathological conditions.
2) Heart rate and conduction analysis:
- assessment of heart rate regularity
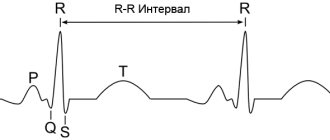
Rhythm regularity is assessed by RR intervals. If the teeth are at an equal distance from each other, the rhythm is called regular, or correct. The spread of the duration of individual RR intervals is allowed no more than ± 10% of their average duration. If the rhythm is sinus, it is usually regular.
- heart rate (HR) counting
The ECG film has large squares printed on it, each of which contains 25 small squares (5 vertical x 5 horizontal).
To quickly calculate heart rate with the correct rhythm, count the number of large squares between two adjacent R-R waves.
At a belt speed of 50 mm/s: HR = 600 / (number of large squares). At a belt speed of 25 mm/s: HR = 300 / (number of large squares).
At a speed of 25 mm/s, each small cell is equal to 0.04 s,
and at a speed of 50 mm/s - 0.02 s.
This is used to determine the duration of the teeth and intervals.
If the rhythm is abnormal, the maximum and minimum heart rate is usually calculated according to the duration of the shortest and longest RR interval, respectively.
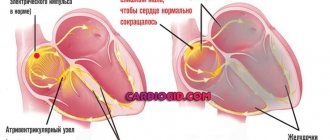
- determination of the excitation source
In other words, they are looking for where the pacemaker is located, which causes contractions of the atria and ventricles.
Sometimes this is one of the most difficult stages, because various disorders of excitability and conduction can be very confusingly combined, which can lead to incorrect diagnosis and incorrect treatment.
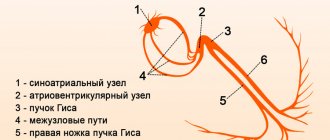
To correctly determine the source of excitation on an ECG, you need to have a good knowledge of the conduction system of the heart.
SINUS rhythm (this is a normal rhythm, and all other rhythms are pathological). The source of excitation is located in the sinoatrial node.
Signs on the ECG:
- in standard lead II, the P waves are always positive and are located before each QRS complex,
P waves in the same lead have the same shape at all times.
P wave in sinus rhythm.
ATRIAL rhythm. If the source of excitation is located in the lower parts of the atria, then the excitation wave propagates to the atria from bottom to top (retrograde), therefore:
- in leads II and III the P waves are negative,
- There are P waves before each QRS complex.
P wave during atrial rhythm.
Rhythms from the AV connection. If the pacemaker is located in the atrioventricular (atrioventricular node) node, then the ventricles are excited as usual (from top to bottom), and the atria are excited retrogradely (i.e. from bottom to top).
At the same time, on the ECG:
- P waves may be absent because they are superimposed on normal QRS complexes,
- P waves can be negative, located after the QRS complex.
Rhythm from the AV junction, superimposition of the P wave on the QRS complex.
Rhythm from the AV junction, the P wave is located after the QRS complex.
Heart rate with a rhythm from the AV junction is less than sinus rhythm and is approximately 40-60 beats per minute.
Ventricular, or IDIOVENTRICULAR, rhythm
In this case, the source of rhythm is the ventricular conduction system.
Excitation spreads through the ventricles in the wrong way and is therefore slower. Features of idioventricular rhythm:
- QRS complexes are widened and deformed (they look “scary”). Normally, the duration of the QRS complex is 0.06-0.10 s, therefore, with this rhythm, the QRS exceeds 0.12 s.
- There is no pattern between QRS complexes and P waves because the AV junction does not release impulses from the ventricles, and the atria can be excited from the sinus node, as normal.
- Heart rate less than 40 beats per minute.
Idioventricular rhythm. The P wave is not associated with the QRS complex.
To properly account for conductivity, the recording speed is taken into account.
To assess conductivity, measure:
- the duration of the P wave (reflects the speed of impulse transmission through the atria), normally up to 0.1 s.
duration of the P-Q interval (reflects the speed of impulse conduction from the atria to the ventricular myocardium); interval P - Q = (wave P) + (segment P - Q). Normally 0.12-0.2 s.
Measuring the internal deviation interval.
3) Determination of the electrical axis of the heart.
4) Analysis of the atrial P wave.
- Normally, in leads I, II, aVF, V2 - V6, the P wave is always positive.
- In leads III, aVL, V1, the P wave can be positive or biphasic (part of the wave is positive, part is negative).
- In lead aVR, the P wave is always negative.
- Normally, the duration of the P wave does not exceed 0.1 s, and its amplitude is 1.5 - 2.5 mm.
Pathological deviations of the P wave:
- Pointed high P waves of normal duration in leads II, III, aVF are characteristic of hypertrophy of the right atrium, for example, with “cor pulmonale”.
- Split with 2 apexes, widened P wave in leads I, aVL, V5, V6 is characteristic of left atrium hypertrophy, for example, with mitral valve defects.
Formation of the P wave (P-pulmonale) with hypertrophy of the right atrium.
Formation of the P wave (P-mitrale) with left atrial hypertrophy.
4) PQ interval analysis:
normally 0.12-0.20 s.
An increase in this interval occurs when the conduction of impulses through the atrioventricular node is impaired (atrioventricular block, AV block).
There are 3 degrees of AV block:
- I degree - the PQ interval is increased, but each P wave corresponds to its own QRS complex (there is no loss of complexes).
- II degree - QRS complexes partially fall out, i.e. Not all P waves have their own QRS complex.
- III degree - complete blockade of conduction in the AV node. The atria and ventricles contract at their own rhythm, independently of each other. Those. idioventricular rhythm occurs.
5) Analysis of the ventricular QRST complex:
- analysis of the QRS complex.
- The maximum duration of the ventricular complex is 0.07-0.09 s (up to 0.10 s).
The duration increases with any bundle branch block.
- Normally, the Q wave can be recorded in all standard and enhanced limb leads, as well as in V4-V6.
- The amplitude of the Q wave normally does not exceed 1/4 of the height of the R wave, and the duration is 0.03 s.
- In lead aVR, there is normally a deep and wide Q wave and even a QS complex.
- The R wave, like the Q wave, can be recorded in all standard and enhanced limb leads.
- From V1 to V4, the amplitude increases (while the rV1 wave may be absent), and then decreases in V5 and V6.
- The S wave can have very different amplitudes, but usually no more than 20 mm.
- The S wave decreases from V1 to V4, and may even be absent in V5-V6.
- In lead V3 (or between V2 - V4), a “transition zone” is usually recorded (equality of the R and S waves).
- RS-T segment analysis
- The ST segment (RS-T) is the segment from the end of the QRS complex to the beginning of the T wave. — — The ST segment is analyzed especially carefully in case of coronary artery disease, since it reflects the lack of oxygen (ischemia) in the myocardium.
Normally, the ST segment is located in the limb leads on the isoline (± 0.5 mm).
- In leads V1-V3, the ST segment may shift upward (no more than 2 mm), and in leads V4-V6 - downward (no more than 0.5 mm).
- The transition point of the QRS complex to the ST segment is called point j (from the word junction - connection).
- The degree of deviation of point j from the isoline is used, for example, to diagnose myocardial ischemia.
- T wave analysis.
- The T wave reflects the process of repolarization of the ventricular myocardium.
In most leads where a high R is recorded, the T wave is also positive.
- Normally, the T wave is always positive in I, II, aVF, V2-V6, with TI> TIII, and TV6> TV1.
- In aVR the T wave is always negative.
- Q-T interval analysis.
- The QT interval is called electrical ventricular systole, because at this time all parts of the ventricles of the heart are excited.
Sometimes after the T wave a small U wave is recorded, which is formed due to short-term increased excitability of the ventricular myocardium after their repolarization.
6) Electrocardiographic report. Should include:
- Source of rhythm (sinus or not).
- Regularity of rhythm (correct or not). Usually sinus rhythm is normal, although respiratory arrhythmia is possible.
- Heart rate.
- Position of the electrical axis of the heart.
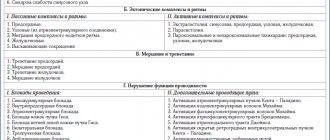
- Presence of 4 syndromes:
- rhythm disturbance
- conduction disturbance
- hypertrophy and/or overload of the ventricles and atria
- myocardial damage (ischemia, dystrophy, necrosis, scars)
ECG interference
In connection with frequent questions in the comments about the type of ECG, I will tell you about the interference that may be on the electrocardiogram:
Three types of ECG interference (explained below).
Interference on an ECG in the lexicon of health workers is called interference: a) induction currents: network interference in the form of regular oscillations with a frequency of 50 Hz, corresponding to the frequency of alternating electric current in the outlet. b) “swimming” (drift) of the isoline due to poor contact of the electrode with the skin; c) interference caused by muscle tremors (irregular frequent vibrations are visible).
ECG analysis algorithm: determination method and basic standards
Conduction function assessment
Previous | Contents | next For a preliminary assessment of the conductivity function (Fig. 4.5), it is necessary to measure the duration of the P7 wave
which characterizes the speed of electrical impulse conduction through the atria,
the duration of the interval P ~ Q (R)
(conduction speed
through the atria, AV node and His system) and the total duration of the ventricular QRS complex
(conduction of excitation through the ventricles). When making these measurements, the speed of ECG recording should be taken into account.
An increase in the duration of these waves and intervals indicates a slowdown in conduction in the corresponding part of the conduction system of the heart.
After this, the internal deviation interval
in chest
leads V and V 6.
More precise diagnostic criteria for specific heart rhythm and conduction disorders will be discussed in detail in Chapters 5 and 6. In the meantime, we suggest you complete several tasks on a general (preliminary) analysis of heart rhythm and conduction. We recommend that you use the diagram of the cardiac conduction system shown under each ECG task, as well as the following algorithm.
Heart Rate and Conductivity Analysis Algorithm
I. Determination of heart rhythm regularity:
1) determine on the ECG and the mark on the diagram (Fig. 4.6) all moments of excitation of the ventricles (according to the
QRS complex);
2) comparing the duration of the intervals R - R,
determine the regularity of ventricular excitation - correct or incorrect rhythm.
II. Heart rate calculation:
1) measure the duration of the R - R
in seconds, remembering that I mm = 0.02 s (at an ECG recording speed of 50 mm-s-1);
2) with the correct rhythm, heart rate is calculated using the formula:
1 yy
— 60
4 CC -7 J =7 f >
or according to table 1;
3) if the rhythm is incorrect, heart rate is calculated based on the number of QRS complexes ,
registered within 3 s (15 cm of paper tape).
III. Determining the source of excitation (pacemaker):
1) determine on the ECG and mark on the diagram all moments of atrial excitation ( P)y
2) in each cardiac cycle, determine and mark on the diagram with an arrow the direction of propagation of excitation through the atria:
I
- the usual direction from top to bottom (with positive waves
Рп
and
Рт)
or
f - unusual direction from bottom to top (with negative teeth Ri
and RT);
3) analyze the relationship between the excitations of the atria and ventricles in each cardiac cycle:
a) determine which part of the heart (atria or ventricles) is excited first;
b) determine whether such a relationship is natural, i.e. whether the same form of P
and the duration of the interval
P ~ Q (R);
4) determine the source of excitation (pacemaker) - sinus or non-sinus (which one specifically?) rhythm. When determining the source of excitation, the criteria set out in Section 4.1.3 should be used.
IV. Conduction function assessment:
1) measure the duration of the pH
(normally no more than 0.1 s);
2) measure the duration of the intervals P - Q ( R )
(normally from 0.12 to 0.2 s);
3) measure the duration of all QRS
(normal range from 0.06 to 0.10 s);
4) measure the interval of internal deviation in leads V, (norm up to 0.03 m) and V 6 (norm up to 0.05 s) on those ECGs where these leads are shown;
5) determine whether or not there are conduction disturbances in the atria, AV conduction system or ventricles (which one exactly?).
In Fig. Figure 4.6 shows an example of heart rate and conduction analysis using a conduction system diagram and the presented algorithm.
Now independently complete the task of preliminary analysis of rhythm and conductivity using the ECG shown in Fig. 4.7 and 4.8. Check the accuracy of the tasks you completed.
Standards of correct answers
Rice. 4.7, a. The rhythm is correct, sinus. Heart rate 103 per minute (tachycardia); />— 0.08 s; R-(KY
- 0.16 s;
QRS -
0.10 s.
Rice.
4.7, b.
The rhythm is regular, sinus; R - R 1.32 s, heart rate 45 per minute (sinus bradycardia), P ~
0.07 s;
P ~ Q ( R }—0.15
s;
QRS —
0.09 s.
Rice.
4.7, c.
The rhythm is irregular, sinus (sinus arrhythmia); R - R
from 0.46 to 0.70 s;
Heart rate * 120 per minute (tachycardia); P -
0.09 s;
P - Q ( R )
- 0.14 s;
QRS -
0.08 s.
Rice. 4.7, d. The rhythm is regular, non-sinus (from the lower parts of the atria); R
- 0.09 cm;
P
waves are negative;
P - Q ( R ) -
0.14 s;
QRS
- 0.08 s.
Rice. 4.7, d. The rhythm is regular, sinus: L-L - 0.84 s; Heart rate - 70 per minute; R
— 0.13 s,
P
are split, with a double-humped apex;
P - Q ( R ) -
0.20 s;
QRS
- 0.08 s. Conclusion; there is a disturbance (due to slowing) of intra-atrial conduction.
Rice.
4.7, e. The rhythm is regular, sinus;
R - R -
0.84 s;
Heart rate
- 70 per minute;
P—0.10 s;
P - QiR ) - 0.24 s;
QRS -
0.09 s. Conclusion: there is a slowdown in AV conduction (1st degree atrioventricular block).
Rice. 4.8, a. The rhythm is regular, sinus; L-L - 0.80 s; Heart rate - 75 per minute; R -
0.08 s;
P - Q { R ) -
0.14 s;
QRS -
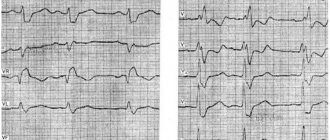
0.17 s; the interval of internal deviation in lead V is 0.10 s, in V 6 - 0.05 s. Conclusion: there is a disturbance in the conduction of electrical impulses through the conduction system of the right ventricle (right bundle branch block),
Rice. 4.8 b. The rhythm is regular, sinus: R - R -
0.70 cm;
Heart rate - 86 per minute; P—0.08 s; P - Q ( R )
- 0.17 s;
QRS -
0D4 s; the interval of internal deviation in V is 0.03 s, in V 6 is 0.10 s.
Conclusion: there is a disturbance in the conduction of the electrical impulse through the conduction system of the left ventricle (left bundle branch block).
Determination of heart rotations around the anteroposterior, longitudinal and transverse axes
In the previous chapter we already said that the configuration of the QRSb
12 electrocardiographic leads is primarily due to the individual characteristics of the spatial location of the three moment vectors of ventricular depolarization and the repolarization vector in relation to the axes of the electrocardiographic leads.
Both moment vectors and the average resulting vectors QRS, P
and
T
can be projected onto the frontal, horizontal and sagittal planes of the body. It is in these planes that the heart rotates, respectively, around the conventional anteroposterior, longitudinal and transverse axes (Fig. 4.9). When deciphering any ECG, it is necessary to determine these turns of the heart.