Supraventricular extrasystole
Supraventricular extrasystole is one of the types of arrhythmia. In this case, an extraordinary excitation of any part of the heart occurs, caused by the occurrence of a premature impulse in the upper parts of the heart or in the antiventricular node.
The causes of supraventricular extrasystole are varied. Extrasystoles are functional and organic. Functional ones can occur in people with a healthy heart, in particular in children and tall young men. This is a rare single supraventricular extrasystole with the number of contractions less than 30 per hour.
Functional extrasystoles are usually classified as having the following origin: neurogenic; diselectrolyte; dishormonal; toxic; medicinal.
Neurogenic, in turn, are divided into hypoadrenergic, hyperadrenergic and vagal.
Hyperadergic extrasystoles are associated with increased physical and mental work, emotional arousal, drinking alcohol, smoking, and eating spicy foods.
Hypoadergic ones are difficult to recognize. Their existence is confirmed by experimental data and clinical observations.
With vagal extrasystole, interruptions in heart contraction occur after eating and during sleep, that is, in a horizontal position.
Organic supraventricular extrasystoles are caused by heart diseases, including:
- cardiac ischemia;
- heart defects;
- cardiomyopathy;
- myocarditis;
- tricuspid valve prolapse;
- mitral valve prolapse with blood returning to the left atrium;
- minor atrial septal defect;
- expansion of the pulmonary artery trunk;
- atrial dilatation in obesity, diabetes mellitus, chronic alcohol intoxication.
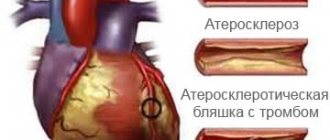
Sinus extrasystole is most often caused by chronic ischemic heart disease. We can talk about the organic nature of supraventricular extrasystole if it develops:
with sinus tachycardia; comes from several foci (polytopic); associated with angina pectoris; extrasystoles more than 30 per hour during ECG monitor recording and more than 5 per minute during examination by a doctor.
Supraventricular extrasystole is one of the types of arrhythmia. In this case, an extraordinary excitation of any part of the heart occurs, caused by the occurrence of a premature impulse in the upper parts of the heart or in the antiventricular node. Etiology and types of supraventricular extrasystoles
The causes of supraventricular extrasystole are varied. Extrasystoles are functional and organic. Functional ones can occur in people with a healthy heart, in particular in children and tall young men. This is a rare single supraventricular extrasystole with the number of contractions less than 30 per hour.
Extrasystoles of the following origin are usually classified as functional:
- neurogenic;
- diselectrolyte;
- dishormonal;
- toxic;
- medicinal.
Enlargement of the thyroid gland and its increased function can often be the cause of supraventricular extrasystole
Neurogenic, in turn, are divided into hypoadrenergic, hyperadrenergic and vagal.
Hyperadergic extrasystoles are associated with increased physical and mental work, emotional arousal, drinking alcohol, smoking, and eating spicy foods.
Hypoadergic ones are difficult to recognize. Their existence is confirmed by experimental data and clinical observations.
With vagal extrasystole, interruptions in heart contraction occur after eating and during sleep, that is, in a horizontal position.
Organic supraventricular extrasystoles are caused by heart diseases, including:
- cardiac ischemia;
- heart defects;
- cardiomyopathy;
- myocarditis;
- tricuspid valve prolapse;
- mitral valve prolapse with blood returning to the left atrium;
- minor atrial septal defect;
- expansion of the pulmonary artery trunk;
- atrial dilatation in obesity, diabetes mellitus, chronic alcohol intoxication.
Sinus extrasystole is most often caused by chronic ischemic heart disease. We can talk about the organic nature of supraventricular extrasystole if it develops:
- with sinus tachycardia;
- comes from several foci (polytopic);
- associated with angina pectoris;
- extrasystoles more than 30 per hour during ECG monitor recording and more than 5 per minute during examination by a doctor.
In addition, supraventricular extrasystole is classified as follows:
- According to the number of ectopic foci: monotopic (one foci), polytopic (several foci).
- By localization: atrial with the source of excitability in the atria and antiventricular - in the septum between the upper and lower parts of the heart.
- By frequency: paired (two extrasystoles in a row), single (less than 5 per minute), multiple (more than 5 per minute), group (several premature contractions in a row).
Often people with supraventricular premature beats have no symptoms. The most characteristic signs:
- Dizziness, feeling of weakness.
- Shortness of breath, lack of air.
- Fear, anxiety, panic, fear of death.
- Interruptions in the work of the heart, a feeling of its revolutions.
- Feeling of heart stopping or freezing.
- After freezing, a push to the chest.
What's on the screen in the ST section The leftmost window shows the averaged “resting ECG” complexes. For averaging, the program selects a fragment of a pure ECG from the entire study at the very minimum pulse without rhythm disturbances. Next to it is a window in which the averaged current cardio complex is presented. In this window, as well as in the main window with the ECG, measurement rulers work. In all windows, the measured ST segment from point j+0.01 s to point j+0.08 s is highlighted. What is considered an ischemic ST deviation ? At a minimum, ST segment displacement beyond the “working threshold” should be considered. The operating threshold is calculated by the program as a ST deviation of 1 mm relative to the resting ECG (at minimum pulse) and further than the “initial thresholds”, which depend on the lead. "Initial thresholds" can be changed in system settings. We propose the following values: Thus, the working threshold for elevation is taken as the upper limit of: – the initial threshold, – the ST level at rest +1 mm. The working threshold for depression is taken to be the lower limit of: – the initial threshold, – the ST level at rest minus 1 mm. For example, if lead V5 ST at rest is -1 mm, then the threshold for elevation will remain 1 mm, and for depression the “working threshold” will become -2 mm. You can change working thresholds when working in the ST section by clicking the “Thresholds” button. Unlike ST shifts during hypertrophy, which are permanent, ischemic ST-T changes are fleeting. We understand the basic rule of “1x1x1” as follows: “in less than 1 minute, the ST segment has shifted by more than 1 mm (0.1 mV) and the duration of the displacement is at least 1 minute.” However, in practice this rule needs slight adjustment. For example, the transition time should sometimes be allowed to be 2 minutes or more. The duration of the displacement is sometimes less than a minute. In the latest version of the program, all thresholds of the “1x1x1” rule are available for adjustment. We have added one more unit to the rule: the duration of the preceding non-ischemic section must also be at least 1 minute, otherwise the rule may work falsely due to interference. In addition, it is proposed to use the “ST/HR” Index when calculating ST in μV. Ischemia criterion if the index decreases below -1.4. The user can change the index threshold or disable its use. All three criteria for “ischemic displacement” are used in the program through the logical “AND” function. Those. to classify a site as “ischemic” there must be: – and the ST deviation is greater than the working threshold, – and the implementation of the “1x1x1” rule (or disabling the rule) – and the ST/HR index value is less than the threshold (or disabling.). Thresholds So, the user can adjust: 1. ST deviation thresholds. In this case, of course, it must start from the level at rest 2. Threshold “Permissible level of interference in the ST section.” 2 mm is recommended out of an acceptable range of 0.5 - 4 mm. 3. Threshold “Minimum number of similar complexes out of 9 possible.” 5 is recommended out of an acceptable range of 3–7. 4. Rule thresholds “1x1x1x1” are recommended 1. 5. Index threshold “ST/HR”. Recommended -1.4 from a possible range of -1 – -2. Protocol In the protocol, the program reflects the number of ischemic episodes, the total time of ischemic ST deviation, the longest ischemic episode, the time and values of the maximum deviations. Negative T trends In order not to overload the program interface in some versions, we removed the analysis of negative T. It turned out that this is such a necessary tool that some users for this reason refused to replace the version. The analysis has now been restored. The user can estimate the maximum values of negative T, the duration of the ECG with T, deeper than a specified threshold. Analysis of the QT interval The duration of the QT interval characterizes the process of repolarization, i.e. the process of restoring the ionic balance of myocardial cells, which begins immediately after depolarization. A strong shortening or strong prolongation of the QT indicates a violation in both cases of the same mechanism of synchronization of the repolarization process, which is a strong arrhythmogenic factor leading to the occurrence of ventricular rhythms, most often in the form of a “pirouette”, which has a high risk of sudden death. Historically, one QT rate has been used to evaluate a long QT and a different QT rate has been used to evaluate a short QT. 1. The prolongation of the QT interval in the program can be assessed in absolute value and relative to the QT norm, depending on heart rate. In this case, to evaluate relative to the norm, you can use the systolic indicator (SP) or QT corrected (QTc), which is basically the same thing, because both QT-norms and QTc are calculated using the Bazet formula: QTm,d=0.37*root (RR) – for men and children. QTf=0.40*root(RR) – for women. These formulas work for heart rates from 40 to 120, and for significant bradycardias and tachycardias they have adjustments depending on age and gender. QTc=QT/root(RR). The program diagnoses “Long QT syndrome” in two cases: a) if QTc> Threshold1 (460 ms for men and children, 470 ms for women) b) if QTc> Threshold2 (440 ms for men and children, 450 ms for women) and there is at least one of the additional signs: - tachyform ventricular rhythm (although it is believed that a long QT provokes the occurrence of ventricular tachycardia in the “pirouette” form, the program still does not exclude the connection of a long QT with any ventricular tachycardia.); - ventricular extrasystole with a preceding SLS sequence (short-long-short, i.e. short-long-short. SLS is a manifestation of the Ashman phenomenon - slowing down of repolarization in the complex after a pause); – “T wave alternation” (this is when the amplitude of the T waves changes greatly from complex to complex on the ECG without interference); – an increase in QT dispersion (QTd) of more than 50 ms (QTd is the maximum difference in QT durations of different leads, provided that the T amplitude is more than 0.3 mV); – decrease in circadian index below 1.2; – reduced heart rate variability in areas of bradycardia; – history of “syncope or sudden death of unknown cause at a young age among close relatives”; - history of diabetes mellitus. 2. QT shortening in the program is evaluated relative to QTp (predict), i.e. due, calculated using the formula proposed by P.Rautaharju based on a survey of 14 thousand practically healthy people. The parameters QTp88 and QTp80 are used, i.e. 88% and 80% of QTp, respectively. For example, with a pulse of 60 beats/min QTp=410, QTp88= 361, QTp80=328 ms. (p. 269, Makarov L.M. Holter monitoring. 2nd ed. - M.: ID "Medpraktika-M". - 2003. - 340 p.) The program puts the conclusion “Short QT syndrome” in two cases: a) QT is less than QTp80, b) QT is less than QTp88 and there is at least one of the additional signs: - a history of “syncope or the fact of sudden death of an unknown cause at a young age among close relatives”, - ventricular rhythm of tachyform, - ventricular extrasystole with a preceding SLS sequence . 3. Program street trends QT, QTp, QTc, QTd, alternations T. The program finds the largest deviations QT, QTc, calculates the total time of deviation QT, QTc is greater than threshold values. Main windows of the interface program 1) ECG viewing window. Here you can set the scale, speed, number of leads. Between two cardiac complexes, either the heart rate or the RR duration is displayed. It is possible to measure the duration and amplitude of ECG parameters. 2) Histograms and tables. There are approximately 90 histograms of the number of violations or deviations by hour. It is very clear to see at what hour there were the greatest number of violations or deviations. By marking with the mouse in the histogram at the right time, you can immediately go to view the ECG at that time. This information is printed in the form of histograms or tables. 3) List of violations. It is represented in the form of a tree. It is the primary mechanism for selecting disorders for review by a physician. It is convenient to view violations with both detailed and general classification. For example, you can view all PVCs or only paired ones or only early ones, etc. In principle, this is a development of the “Super Imposition” mode. 4) Rhythmogram. On it, various violations and interference are marked in different colors. Separately, episodes of rhythm, transient conduction disturbances, etc. are noted. Over time, this window becomes the doctor’s favorite window for analyzing rhythm disturbances. 5) Trends (graphs) of pulse, ST, PQ, QT, etc. There is a mechanism for accessing the brightest places (minimum, maximum pulse, maximum ST deviation, etc.) Conveniently, it is possible to change the trend scale (all 24 hours, 6 hours, 1 hour, 30 minutes), i.e. It is possible to generally evaluate, for example, the pulse or ST graph for the entire examination time, and look at the dynamics in more detail. Editing and receiving the protocol 1) Study by sections. As already noted, the protocol is automatically generated from 10 sections. Therefore, it is logically recommended that the entire study be carried out in sections. Having selected a section, it is convenient to move within this topic between histograms, a list of violations, ECG graphs, trends and a fragment of the protocol conclusion. Convenience stems from the fact that when working on some topic, for example, ST, everything related to ST is, as it were, “at hand.” 2) Transitions. A common cursor strategy has been implemented for the ECG window, rhythmogram and all trends. Those. Scrolling through the ECG, the cursor will move on the rhythmogram and trends. If you click the mouse anywhere on the rhythmogram or trends, the ECG will also move. 3) Versatility of editing. It is possible to edit at different levels: – classification of individual cardiac complexes, – entire groups of disorders at once, for example, the entire group of ventricular extrasystoles of a certain shape can be classified at once as “supraventricular extrasystoles with aberrant conduction” – ECG episodes (rhythm, transient blockades, etc.), – text of the protocol conclusion. 4) Unified list of violations. Wherever editing is performed, it automatically affects everywhere: in the conclusion and in histograms and in tables and in lists of violations. 5) Printing graphs. As the ECG is examined, the doctor sends examples of ECGs, trends, and rhythmograms to the print queue. Moreover, the program will automatically prepare a comment, for example, “maximum pulse”, “paired ventricular extrasystole”, etc. The doctor can correct the comment. The doctor can view the selected fragments and remove them from the queue, for example, replacing them with a more successful one. At the end of the study, the doctor sends the fragments to the printer, and you can set the page orientation (landscape or portrait). The program will try to make the most of each page by placing several fragments on them. 6) Research protocol So, the protocol consists of fragments of graphs, a conclusion, which is formed from fragments for each section, a summary table, which can be on one or several pages, depending on the volume of identified violations. Conveniently, the structure of the conclusion and tables can be specified using checkboxes. For example, if you don’t need the rhythm variability section, or the QT section, you just need to uncheck the corresponding box. Recorder At the moment, there are two types of recorders supplied with the complex: 1) 2/3-channel recorder (2-channel recording is used for infants). Up to 24 hours of continuous recording. 2) Universal recorder. Possibility of recording 3/12 leads. IVR detector. Up to 72 hours of continuous recording. References 1. A. Dabrowski, B. Dabrowski, R. Piotrovich. Daily ECG monitoring: (translation: Korneev N.V., Grabko N.N., Bannikova S.D.) - M.: Medpraktika, 1998. - 208 p. 2. Makarov L.M. “Holter monitoring” M.: Medpraktika publishing house, 2000, p. 216 3. Ryabykina G.V., Sobolev A.V., Heart rate variability. M.: Star'Ko, 1998, 200 p. 4. Grigorov S.S., Votchal F.B., Kostyleva O.V. Electrocardiogram with artificial cardiac pacemaker. – M.: Medicine, 1990. 240 p.
magazine "Polyclinic No. 2", pp. 16–20, 2007
Classification and types
There are many types of NLEs, divided according to different characteristics.
Depending on the source of the impulse, atrial extrasystoles and extrasystoles (ES) from the atrioventricular (AV) connection are distinguished. Based on the number, they distinguish between single and double. Three or more ES in a row is already considered an episode of tachycardia (also called a “jog”).
In my patients, I often observe such an ECG phenomenon as allorhythmia - the regular occurrence of extrasystoles. There are the following types:
- bigeminy - the appearance of ES on the cardiogram after each normal contraction of the heart (read more about this phenomenon here)
- trigeminy - after every second complex;
- quadrigeminy - after every third complex.
Depending on the cause, the following types of NVEs are distinguished:
- functional - during physical activity, reflex effects;
- organic - for heart diseases;
- toxic - in case of drug overdose;
- mechanical - for injuries.
Single extrasystoles
The most benign variant of NVE, mainly found in healthy individuals, are single supraventricular extrasystoles. They almost always go unnoticed by humans and do not pose a threat to health.
Symptoms of supraventricular tachycardia
- cardiopalmus;
- severe dizziness, lightheadedness, fainting;
- feeling of lack of air and difficulty breathing, chest pain;
- pronounced decrease in blood pressure;
- Feelings of fear, panic and anxiety may often be present.
More often, an attack of arrhythmia lasts up to 1 hour (usually 5-20 minutes), attacks can be repeated with varying frequencies. Some patients can independently cope with the next attack by taking certain medications (“a pill in the pocket”) or so-called vagal tests (pressing on the eyeballs, wiping with cold water, etc.)
It is also worth remembering that some types of arrhythmia have absolutely identical symptoms, but unlike supraventricular rhythms, they are life-threatening. That is why a full examination is necessary in order to determine the type of arrhythmia and decide on the need for treatment.
general description
Supraventricular tachycardia
is a common type of arrhythmia that originates in a zone located above the ventricles of the heart. The main features of this type of arrhythmia are a sharp increase in heart rate and the persistence of a pathological rhythm for a certain period of time. Currently, this heart disorder is very common in people over 20 years of age.
There are five main types of supraventricular arrhythmias, different in etiology and pathophysiology: atrioventricular nodal tachycardia, atrioventricular tachycardia, atrial tachycardia, intraatrial tachycardia, sinoatrial reentrant tachycardia (it should be noted that such types of supraventricular arrhythmias as atrial fibrillation and atrial flutter, as a rule, are worth apart from this group).
At risk:
men and women regardless of age
Treatment: when, how and with what
Supraventricular extrasystoles are almost always benign. If extraordinary contractions of the heart are single, are not accompanied by any symptoms and do not provoke the occurrence of severe rhythm disturbances, treatment of supraventricular extrasystole is not required. The main thing is to fight its cause.
When EVE worsens the patient's condition, I prescribe drug therapy. The most effective drugs for stopping SE are beta-blockers - Bisoprolol, Metoprolol. If there are contraindications to their use (for example, severe bronchial asthma), I transfer the patient to slow calcium channel blockers - Verapamil, Diltiazem. Read about how extrasystole is treated with medications here.
As for traditional methods, to date there is no convincing evidence of their effectiveness. In my practice, I recommend that patients under no circumstances replace traditional treatment with traditional medicine. But if you have a different opinion, we invite you to read the material here.
If the development of NVE is associated with emotional stress or a neurotic disorder, you can take sedatives and make an appointment with a psychotherapist.
The main criteria for the success of therapy are the cessation of symptoms and normalization of the patient’s condition.
In rare cases, when drug treatment does not have the expected positive effect, surgical intervention is used, in particular, a technique such as radiofrequency catheter ablation. I usually prescribe this operation to young patients, since with age the risk of developing severe complications, including death, increases.
It is extremely rare, for health reasons, that an open access operation is performed, with dissection of the chest and removal of the portion of the myocardium where extraordinary impulses are formed.